HDFC Bank merged entity may see $150-200 mn outflows post MSCI large-cap index inclusion.
MSCI has reduced the adjustment factor for computing the weight of the HDFC Bank merged entity in the MSCI India Index from 1x to 0.5x. As a result, passive funds that track the index may need to sell shares of the merged entity to adjust their holdings to match the index’s weighting. This could result in outflows of $150-200 million from the merged entity following its inclusion in the index.
However, the amount of outflows will depend on the index’s weightage assigned to the stock and the current holdings of passive funds. It’s important to note that these outflows are usually temporary and can be offset by active buying from investors who have a positive view of the company’s prospects.It’s worth noting that the previous expectation was that the merged entity would see $3 billion in inflows due to its inclusion in the index. However, the change in the adjustment factor has led to a reduction in this expected inflow amount.
Fundamental Analysis of HDFC Bank
Despite the potential for short-term outflows, the long-term outlook for HDFC Bank remains strong given its position as one of India’s largest private sector banks and its strong financial performance in recent years.
HDFC Bank is one of India’s largest private sector banks and has a strong financial performance history. Despite the potential for short-term outflows, the bank’s long-term outlook remains favorable.

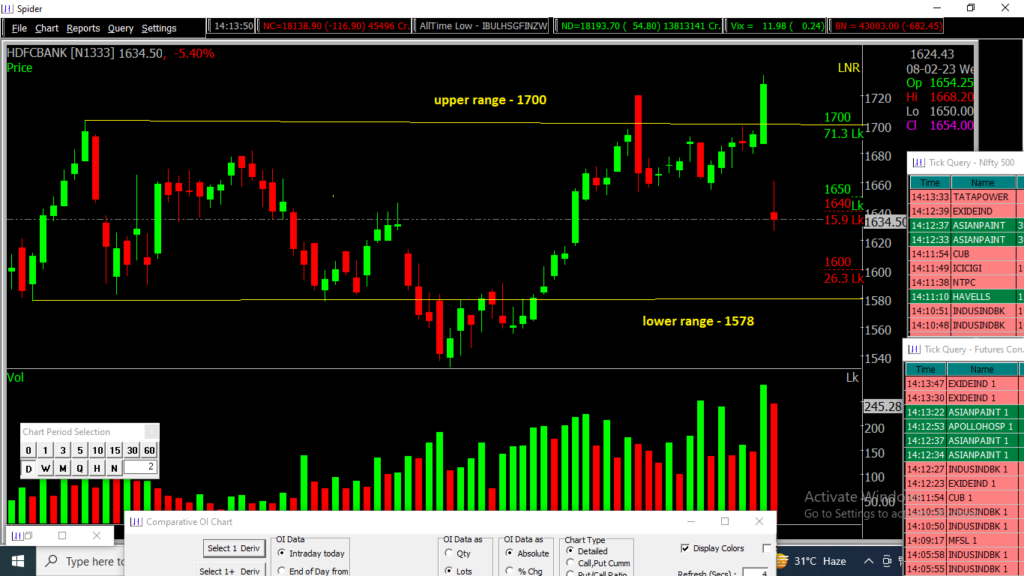
Technical view of HDFC Bank:
After creating its “ALL TIME HIGH” Record, on Friday Morning, the shares of HDFC Bank came down to Rs 1626, which is almost down by -5.5%. There was a heavy call writing at the Strike Price of 1700 and 1640 respectively, Which also led to the fall of the stock’s price. If the HDFCBANK price falls further, The range for the downside can go up to Rs 1578 and for the upper range it can rise upto Rs 1700 & in case if it goes above Rs 1700 then it may hit the “ALL TIME HIGH” Record of Rs 1735.
Also, check out our Blog Beginners Guide on Technical Analysis.
If you are interested in learning, how to identify the fall and rise of stocks, how the technical analysis works, and how to implement strategies in your trading set-up, then register for our upcoming webinar. Register Here.

Disclaimer: The information provided in this Blog is for educational purposes only and should not be construed as financial advice. Trading in the stock market involves a significant level of risk and can result in both profits and losses. Spider Software & Team does not guarantee any specific outcome or profit from the use of the information provided in this Blog. It is the sole responsibility of the viewer to evaluate their own financial situation and to make their own decisions regarding any investments or trading strategies based on their individual financial goals, risk tolerance, and investment objectives. Spider Software & Team shall not be liable for any loss or damage, including without limitation any indirect, special, incidental or consequential loss or damage, arising from or in connection with the use of this blog or any information contained herein.