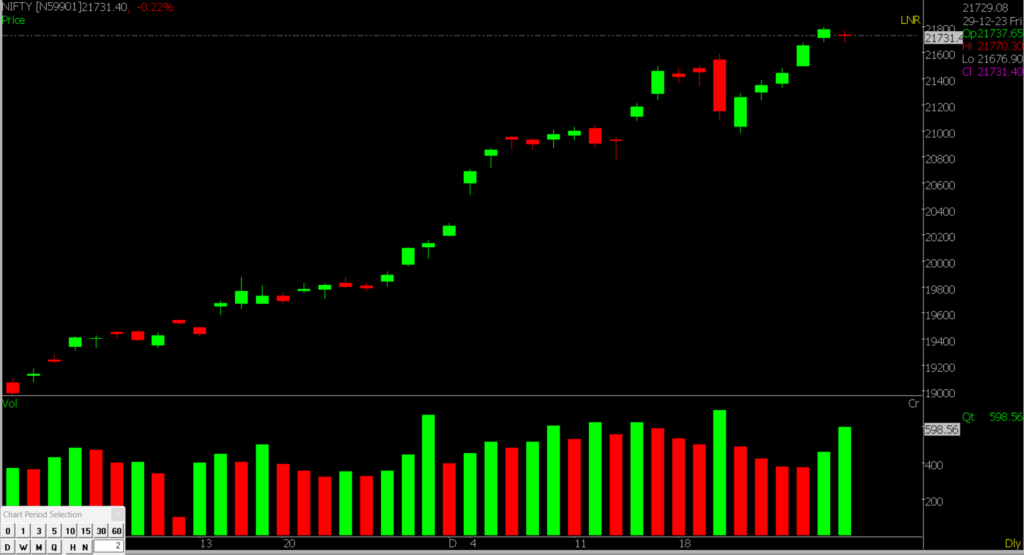
Today’s Stock Market is a steadfast conclusion to 2023; Nifty wraps up at 21,730, while Sensex stands at 72,240.
Stock Market Nifty Chart Prediction.
2023 brought a mix of challenges and opportunities to both Indian and global equity markets. Despite a cautious start and early volatility, the Indian market showed a remarkable rebound in the latter half of the year, recovering from the lows in March 2023. As we enter 2024, India is expected to continue standing out amidst the complexities faced by other emerging economies. The anticipated growth momentum is backed by the strengthened balance sheets of Indian corporations and the improved health of the banking system. These factors position Indian equities for double-digit returns in the coming two to three years, supported by robust earnings growth.
Stock Prediction for 01st Jan 2024
1) BAJAJFINSV: Good Above 1702, Weak Below 1680
2) COROMANDEL: Good Above 1260, Weak Below 1242
3) TATAPOWER: Good Above 333, Weak Below 328
4) MARICO: Good Above 552, Weak Below 546
Prediction For Monday NIFTY can go up if it goes above 21800 or down after the level of 21500 but all depends upon the Global cues.
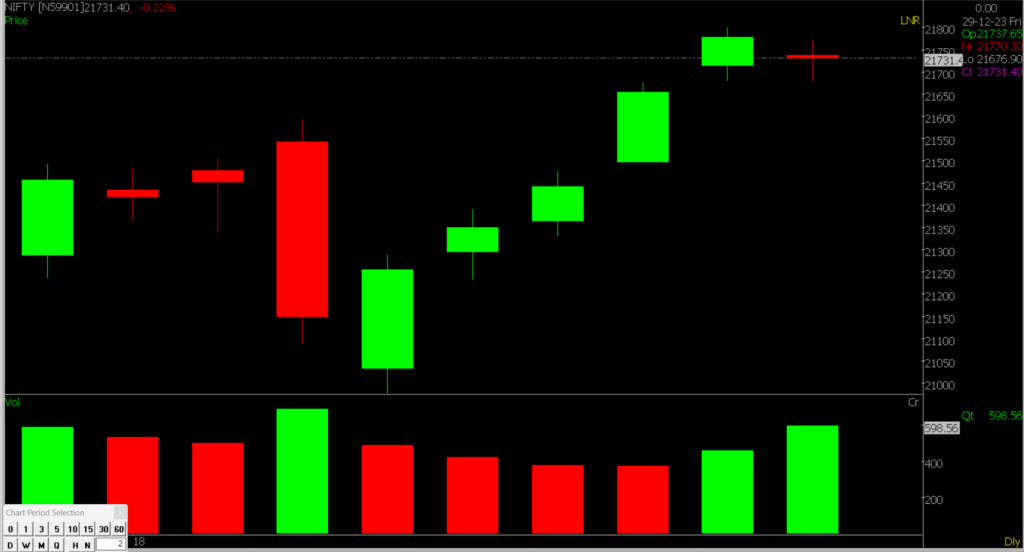
On the last trading day of the year, the market took a pause and closed with a small decline. Nifty, after an initial drop, moved within a narrow range and ended at 21,731.40 levels. Various sectors showed mixed trends, with auto and FMCG gaining, while energy, IT, and banking saw some profit-taking. The broader market remained relatively strong, easing overall pressure.
Further consolidation is anticipated in the index, which is considered healthy following recent gains. Support is expected around 21500 – 21,300 during consolidation, and the resistance remains at 21800-22000.
| Highest Call Writing at | 21800 |
| Highest Put Writing at | 21500 |
Nifty Support and Resistance
| Support | 21500, 21300 |
| Resistance | 21800, 22000 |
Bank Nifty Daily Chart Prediction
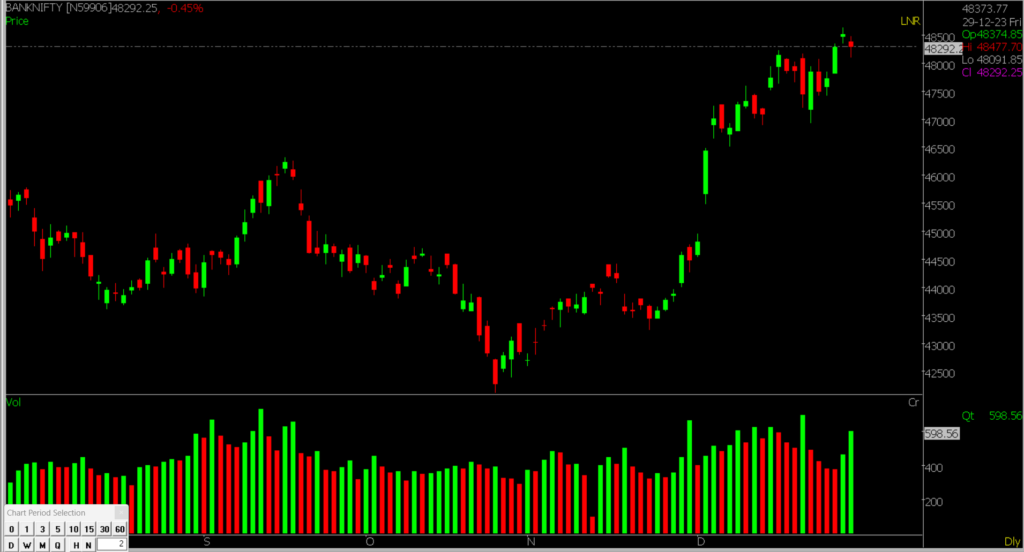
Prediction For Monday Bank NIFTY can go up if it goes above 48500 or down after the level of 48000 but it all depends upon the Global cues.
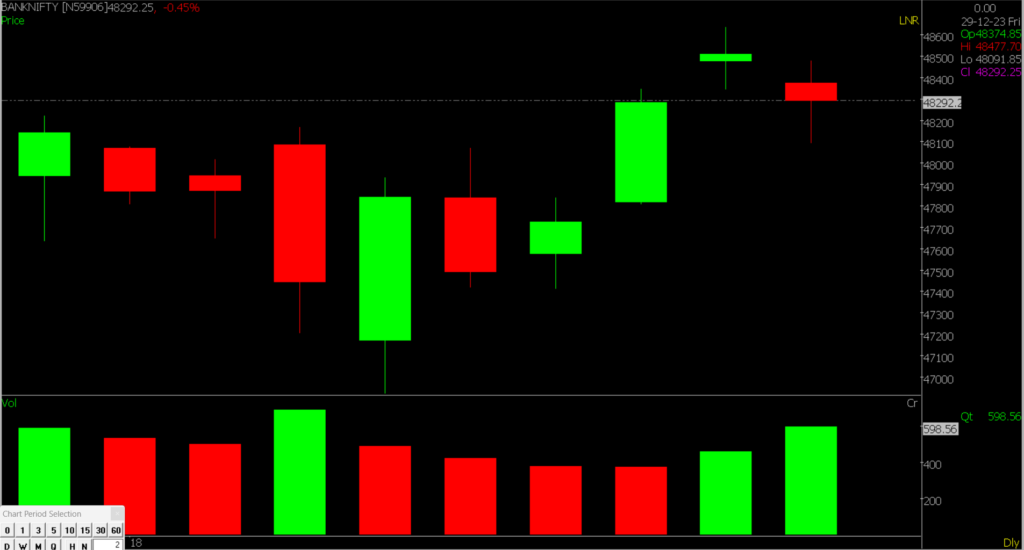
Bank Nifty saw a downward move, creating a small red-bodied candle on the daily chart. The resistance level is at 48,500. If the index remains below 48,500, the trend may favor the bears. Additionally, a clear drop below 48,000 could push the index below 47,500. On the other hand, a decisive breakthrough above 48,500 might lead the index towards 48,800-49,000 on the higher side.
| Highest Call Writing at | 48500 |
| Highest Put Writing at | 48000 |
Bank Nifty Support and Resistance
| Support | 48000, 47500 |
| Resistance | 48500, 48800 |
Also, check our Article on how Rounding Top Pattern is formed on various stocks.
If you’d like to know how we analyze the market and provide accurate levels every day. then click on the Free Demo button below and change your trading life for good. 5X returns are possible in options trading If you have Spider Software in your trading system.
Disclaimer: The information provided in this Blog is for educational purposes only and should not be construed as financial advice. Trading in the stock market involves a significant level of risk and can result in both profits and losses. Spider Software & Team does not guarantee any specific outcome or profit from the use of the information provided in this Blog. It is the sole responsibility of the viewer to evaluate their own financial situation and to make their own decisions regarding any investments or trading strategies based on their individual financial goals, risk tolerance, and investment objectives. Spider Software & Team shall not be liable for any loss or damage, including without limitation any indirect, special, incidental or consequential loss or damage, arising from or in connection with the use of this blog or any information contained herein.