
In the Stock Market Today, Sensex falls by 800 points as Nifty near 22,500; declines seen across all sectors.
Stock Market Nifty Chart Prediction.
On April 12, Sensex dropped 793.25 points, closing at 74,244.90, while the Nifty fell by 234.40 points, to finish at 22,519.40. In the stock market, 1,305 shares moved upward, -1,988 shares saw declines, and 68 shares remained unchanged.
Top Nifty gainers: Divis Labs, Tata Consumer Products, Bajaj Auto, Tata Motors and TCS,
Top Nifty Losers: Sun Pharma, Maruti Suzuki, Power Grid Corporation, Titan Company and ONGC.
Every sectoral index finished lower, with banking, healthcare, FMCG, media, real estate, and oil & gas sectors each declining by 1%.
BSE Midcap and Smallcap indices fell 0.5 percent each.
Stock Prediction for 15th April 2024.
| STOCK | Good Above | Weak Below |
| BHARTIARTL | 1230 | 1216 |
| CUMMINSIND | 3080 | 3045 |
| INDHOTEL | 612 | 605 |
| TATAPOWER | 441 | 435 |
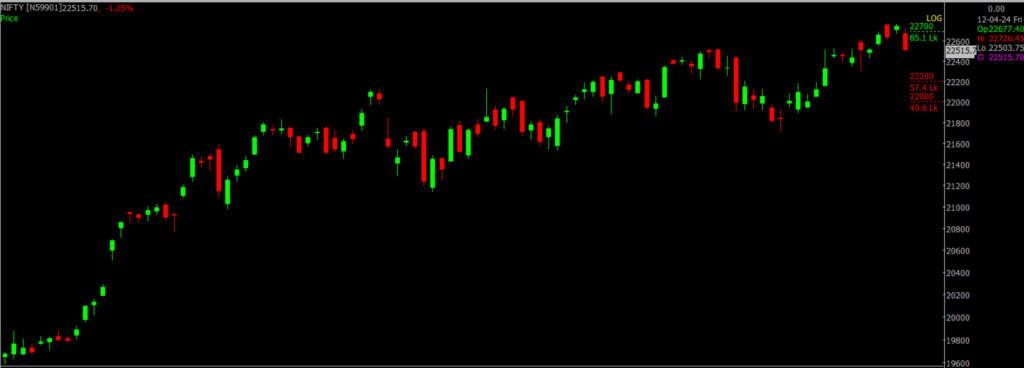
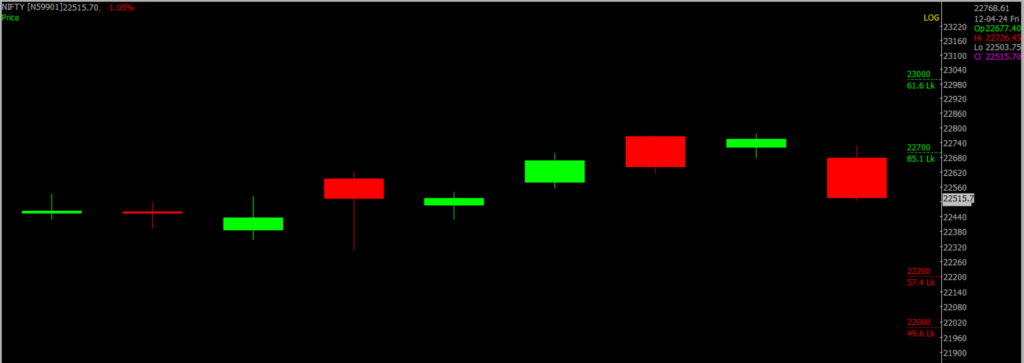
Prediction For Monday, NIFTY can go up if it goes above 22,750 or down after the level of 22,700 but all depends upon the Global cues.
Nifty began with a gap down and continued to decline after some initial fluctuations, closing near its daily lows with a loss of 234 points. The index is currently retracing its recent gains from 22710 to 22776 and is consolidating at these levels. Looking forward, crucial support is found between 22400 and 22200, while the 22700 to 22800 range is expected to serve as resistance in the short term.
| Highest Call Writing at | 22,700 (85.1 Lakhs) |
| Highest Put Writing at | 22,400 (57.4 Lakhs) |
Nifty Support and Resistance
| Support | 22,400, 22,200 |
| Resistance | 22,700, 22,800 |
Bank Nifty Daily Chart Prediction.
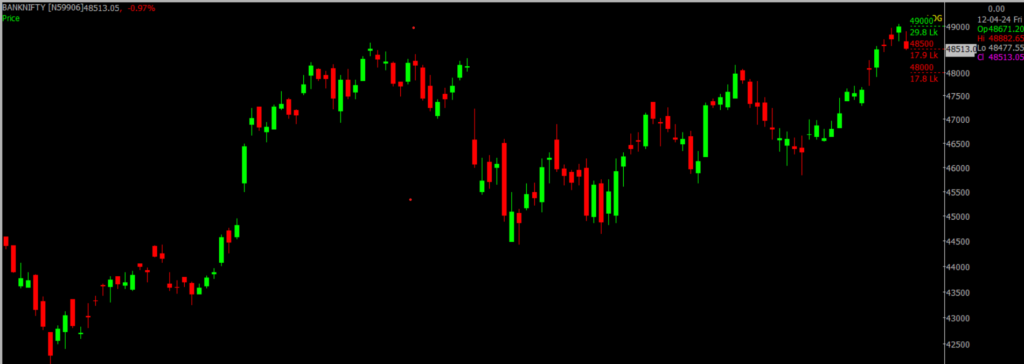
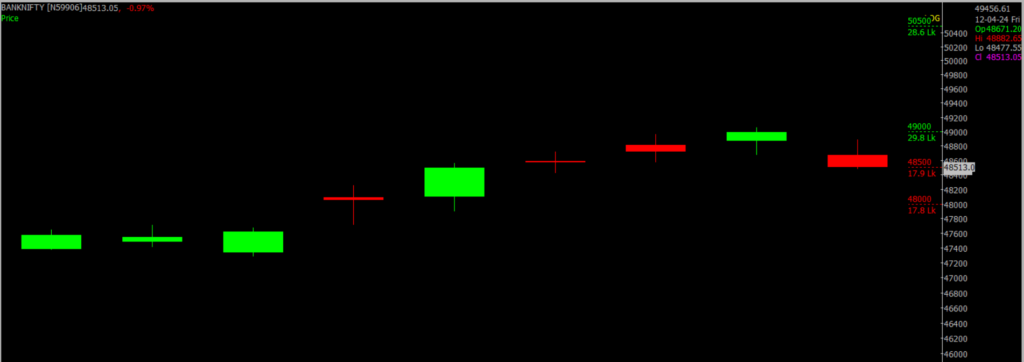
Prediction For Monday, Bank NIFTY can go up if it goes above 49,000 or down after the level of 48,500 but it all depends upon the Global cues.
BankNifty index is experiencing significant selling, indicating a return of bearish trends after a long period of stability. The index faces major resistance at the 49,000-50,000 level, and a decisive close above this range is necessary to potentially restart its ascent towards 50,000. Immediate support for the index is found between 48,500 and 48,000, the area with the highest concentration of open interest on the put side. If it breaks below this crucial support range, we could see an increase in selling pressure.
| Highest Call Writing at | 49,000 (29.8 Lakhs) |
| Highest Put Writing at | 48,500 (17.8 Lakhs) |
Bank Nifty Support and Resistance
| Support | 48,500, 48,000 |
| Resistance | 49,000, 50,000 |
Click here to learn the Difference Between Cryptocurrencies and Stocks.
Join our upcoming free Webinar on Understanding Price Action Techniques: A Guide to Effective Trading
If you’d like to know how we analyze the market and provide accurate levels every day. then click on the Free Demo button below and change your trading life for good. 5X returns are possible in options trading If you have Spider Software in your trading system.
Disclaimer: The information provided in this Blog is for educational purposes only and should not be construed as financial advice. Trading in the stock market involves a significant level of risk and can result in both profits and losses. Spider Software & Team does not guarantee any specific outcome or profit from the use of the information provided in this Blog. It is the sole responsibility of the viewer to evaluate their own financial situation and to make their own decisions regarding any investments or trading strategies based on their individual financial goals, risk tolerance, and investment objectives. Spider Software & Team shall not be liable for any loss or damage, including without limitation any indirect, special, incidental or consequential loss or damage, arising from or in connection with the use of this blog or any information contained herein. ![]()