
While there is no one-size-fits-all tool to predict reversals with absolute certainty, several technical analysis tools and methods can be used in combination to identify potential reversals.
Understanding trends is essential for traders because market conditions are always changing. No trend goes on forever, and at some point, the direction in which you are trading will reverse, and a new trend will begin. Technical analysis helps traders identify when a trend is about to change direction or confirm a trend reversal.
Traders need to be aware of these potential reversals for two reasons. First, if they already have a position based on a trend, they want to exit it before the trend reverses to avoid losses. Second, a reversal indicates the start of a new trend, and if they can spot it quickly, they can join in and make profits.
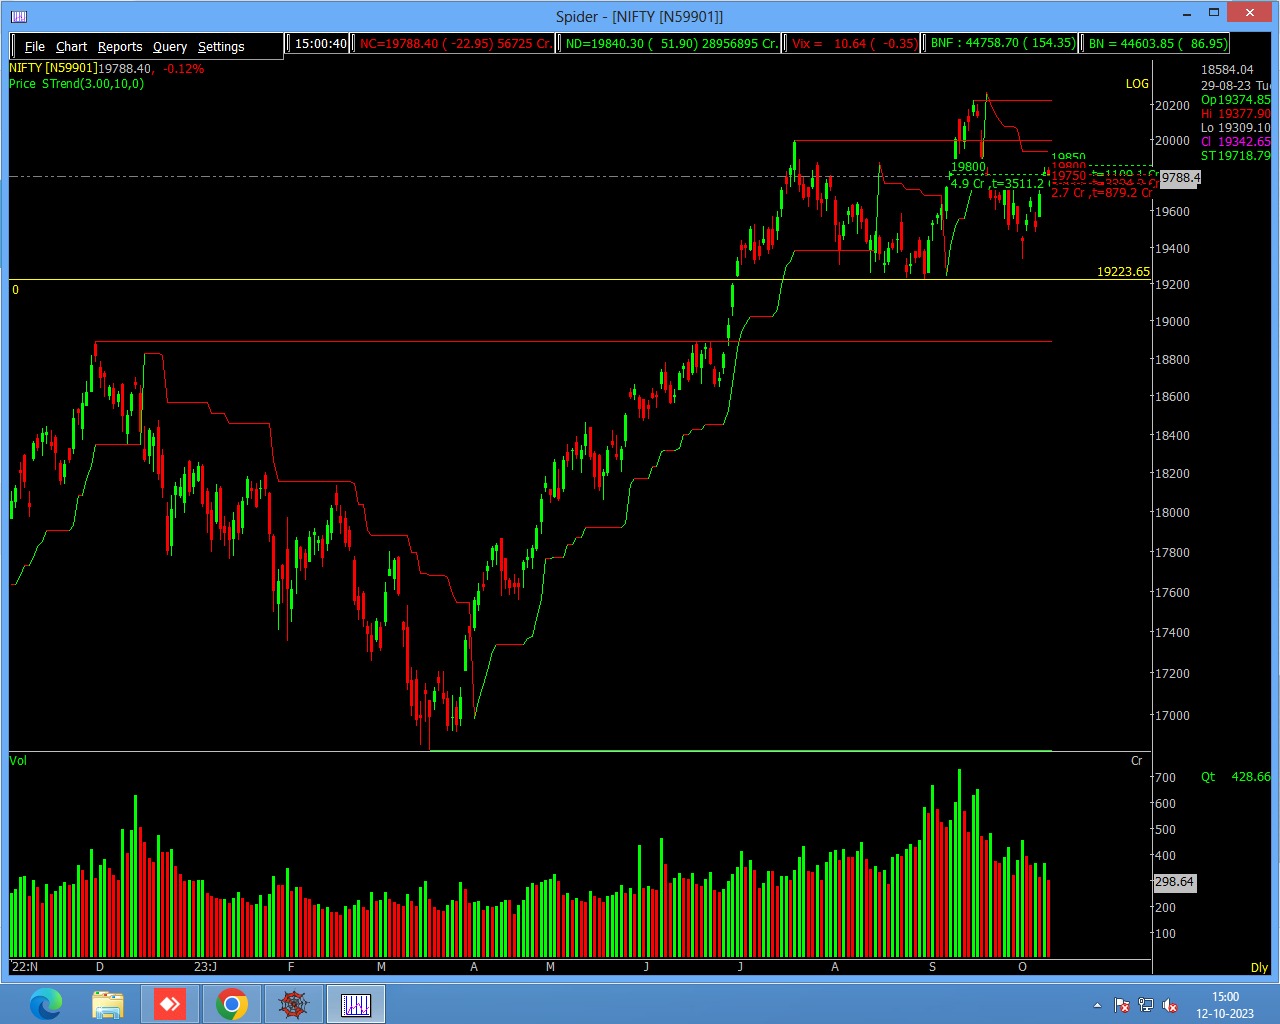
Super Trend
To spot a trend reversal using the Supertrend indicator, focus on two key elements: the Supertrend line’s position relative to the price and the trend direction line. If the Supertrend line is below the price, it suggests an uptrend, while if it is above the price, it indicates a downtrend.
Watch for a change in the trend direction line from positive to negative, which signals a potential trend reversal from uptrend to downtrend, or from negative to positive, indicating a potential reversal from downtrend to uptrend. Confirm the signal with price action and consider using other indicators for validation. Practice on historical data to validate the indicator’s accuracy, but always exercise caution and apply risk management techniques, as no indicator is infallible, and false signals can occur. Utilizing multiple indicators and technical analysis tools can increase the reliability of spotting trend reversals using the Supertrend indicator in your trading strategy.
Price Action
It forms the basis for all technical analysis of stock, commodity or other asset charts. Many short-term traders rely solely on price action and the resulting formations and trends to make trading decisions. Technical analysis as a practice derives from price action as it utilizes past prices in calculations that inform trading decisions.
Price action trading is a “pure” form of technical analysis as it does not contain any secondary price derived indicators. Traders focus solely on the first-hand data generated by the market itself, which is the price movement over time. Some traders refer to price action trading as ‘pure chart trading’ or ‘raw trading,’ emphasizing the use of a simple price chart with a focus solely on price action.”
it is much easier to analyse the market and trade based on its price action than to try to decipher and sort through the many different variables that affect the market every day.
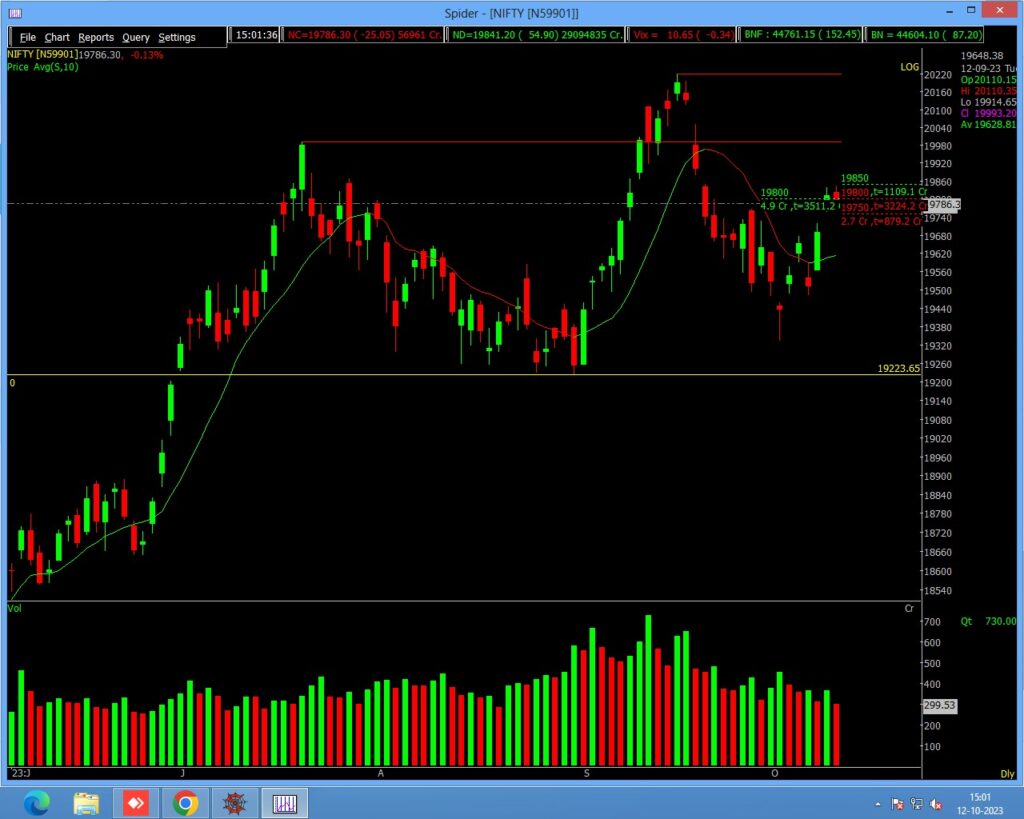
Moving Average:
The moving average is a popular technical analysis tool used by traders and investors to identify trends and potential trend reversals in stocks. It helps smooth out price data over a specific period, making it easier to discern the underlying trend.
- Select the Type of Moving Average: There are different types of moving averages, such as simple moving averages (SMA) and exponential moving averages (EMA). The choice between them depends on your trading strategy and time frame. SMAs give equal weight to all data points in the period, while EMAs give more weight to recent data, making them more responsive to recent price changes.
- Select the Period: Determine the time frame for your moving average. In short-term trading, traders often use shorter periods, such as 10 or 20 days, because they are more sensitive to recent price changes Longer periods, like 50 or 200 days, are better for identifying long-term trends.
- Plot the Moving Average: Plot the selected moving average on a stock price chart. This line represents the average price over the chosen period.
- Identify Crossovers: Pay attention to crossovers between the stock’s price and the moving average. When the stock’s price crosses above the moving average, it’s considered a bullish signal, indicating a potential trend reversal from bearish to bullish.
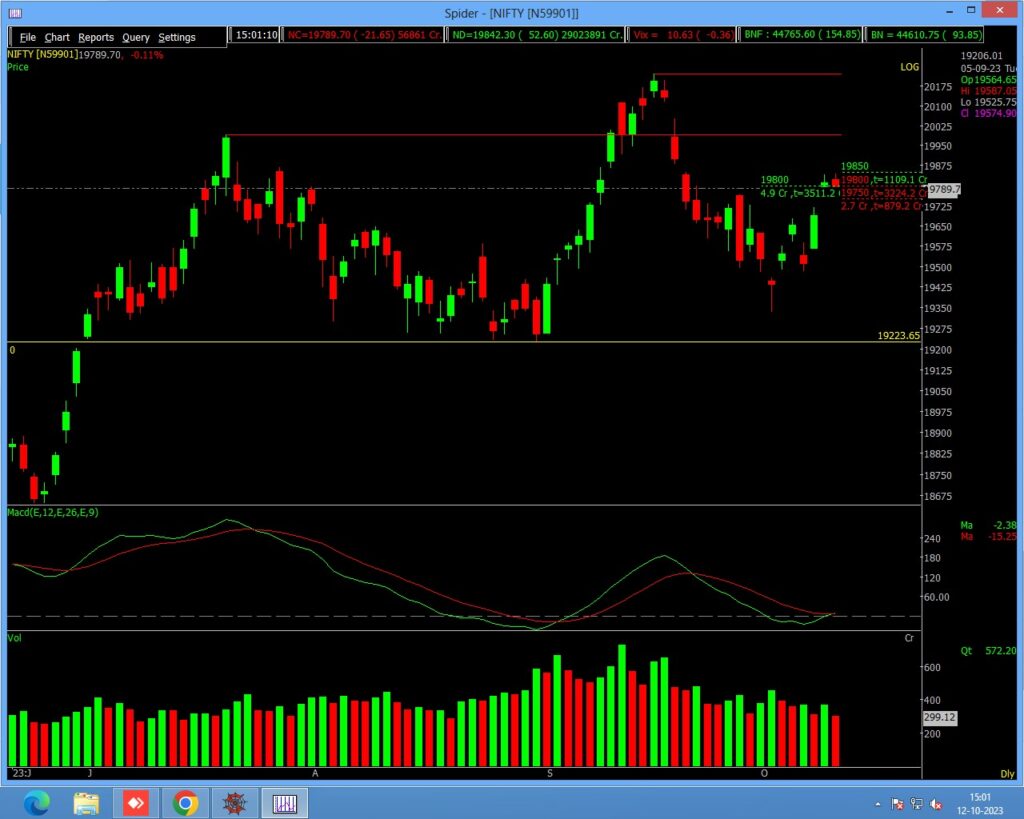
Moving Average Convergence Divergence
Traders and investors use the Moving Average Convergence Divergence (MACD) as another popular technical indicator to identify potential trend reversals in stocks. It is a versatile tool that combines both trend-following and momentum aspects.
- Understanding MACD Components:
- MACD Line: This is the main line, calculated by subtracting the 26-period Exponential Moving Average (EMA) from the 12-period EMA. It represents short-term momentum.
- Signal Line: The signal line is a 9-period EMA of the MACD line. It helps smooth out the MACD line, making it more responsive to changes.
- MACD Histogram: Subtracting the signal line from the MACD line creates the histogram.”
- It provides a visual representation of the difference between the MACD line and the signal line.
- Identify MACD Crossovers:
- Bullish Crossover: When the MACD line crosses above the signal line, it generates a bullish signal, suggesting a potential trend reversal from bearish to bullish.
- Bearish Crossover: When the MACD line crosses below the signal line, it generates a bearish signal, suggesting a potential trend reversal from bullish to bearish.
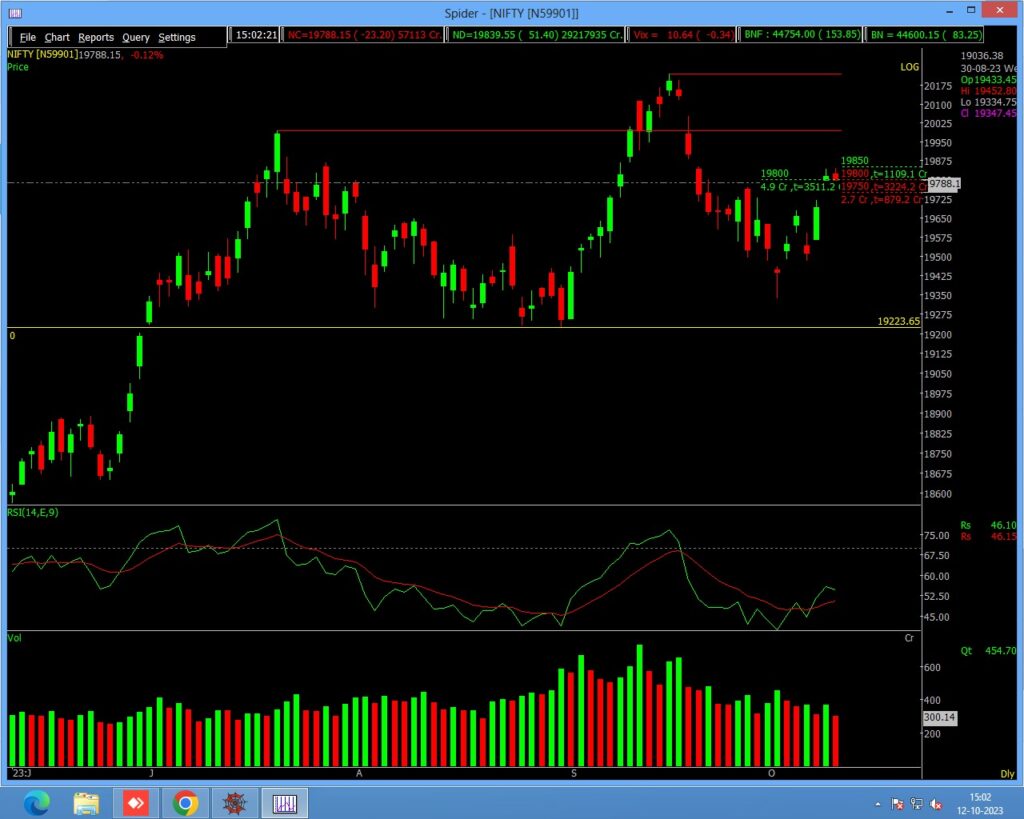
Relative Strength Index (RSI)
Traders widely use the Relative Strength Index (RSI) as a momentum oscillator in technical analysis to help identify potential trend reversals in stocks. RSI measures the speed and change of price movements and ranges from 0 to 100, with readings above 70 typically indicating an overbought condition and readings below 30 indicating an oversold condition. Here’s how you can use the RSI to find trend reversals in stocks:
- Understanding RSI Levels:
- When the RSI exceeds 70, it suggests that the stock may be overbought, indicating that the price has risen too far, too fast. This could indicate a potential reversal from bullish to bearish.
- When the RSI falls below 30, it suggests that the stock may be oversold, indicating that the price has fallen too far, too fast. This could signal a potential reversal from bearish to bullish.
Also, Check our Article on Zero to Hero Option Trading Strategy (80% ACCURACY) – 2023
Disclaimer: The information provided in this Blog is for educational purposes only and should not be construed as financial advice. Trading in the stock market involves a significant level of risk and can result in both profits and losses. Spider Software & Team does not guarantee any specific outcome or profit from the use of the information provided in this Blog. It is the sole responsibility of the viewer to evaluate their own financial situation and to make their own decisions regarding any investments or trading strategies based on their individual financial goals, risk tolerance, and investment objectives. Spider Software & Team shall not be liable for any loss or damage, including without limitation any indirect, special, incidental or consequential loss or damage, arising from or in connection with the use of this blog or any information contained herein.