Elliott Wave Patterns helps Market Behaviour to be simple to understand! But, before delving into patterns, let’s grasp the basics of the Elliott Wave Patterns Principle:
What is the Elliott Wave?
The Elliott Wave Principle, a form of technical analysis, aids traders in analyzing financial market cycles. It revolves around forecasting market trends by identifying extremes in prices and investor psychology. This theory suggests that market movements follow a sequence of crowd psychology cycles, alternating between bullish and bearish cycles.
It’s essential to note that the Elliott Wave is not a technical indicator but a theory facilitating market behavior prediction. This blog explores the five main types of Elliott Wave Patterns crucial for predicting market dynamics.
According to the Elliott Wave Theory, stock prices move in recurrent waves, reflecting traders’ psychology. As these patterns repeat, predicting stock price movements becomes more feasible. Observing these waves provides insights into ongoing trend dynamics and aids in a deeper analysis of price movements. However, it’s crucial to acknowledge the subjective nature of interpreting the Elliott wave, as investors may interpret it differently.
Before jumping into the types, the Elliott Waves is classified into 2 categories.
Categories of Elliott Wave
1. Motives Waves:
Motive waves, labeled as Wave 1 through Wave 5, move in the direction of the main trend. Waves 1, 2, and 3 align with the primary direction, while Waves 2 and 4 move oppositely. Motive Waves are typically categorized into two types: Impulse Waves and Diagonal Waves.
2. Corrective Waves:
Corrective waves, countering the main trend, consist of three waves labeled A, B, and C. These correction patterns—Zig-Zag, Diagonal, and Triangle Waves—are more intricate and time-consuming than motive waves. Now, let’s dive into Elliott Wave Patterns.
Types of Elliott Patterns:
1. Impulse Pattern:
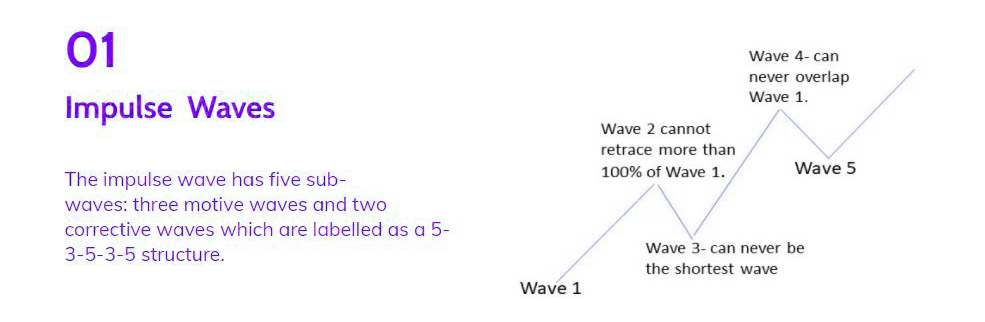
Impulse, the most common motive wave, is easily identifiable in the market. Like all motive waves, it comprises five sub-waves: three motive waves and two corrective waves, forming a 5-3-5-3-5 structure. However, specific rules govern its formation. If any rule is breached, the impulse wave must be re-labeled. The three rules are:
- Wave 2 cannot retrace more than 100% of Wave 1.
- Wave 3 must be longer than waves 1, 3, and 5.
- Wave 4 should not overlap Wave 1.
The primary objective of an impulse wave is to drive the market, and impulses excel in achieving this goal.
2. Diagonal Pattern:
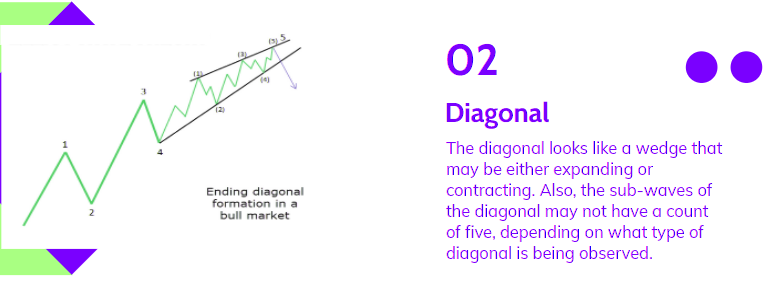
Diagonal waves, another form of motive wave, consist of five sub-waves and follow the trend’s direction. Diagonals resemble wedges, either expanding or contracting, and the sub-waves may not always total five, depending on the diagonal type.
Similar to other motive waves, each sub-wave of the diagonal doesn’t fully retrace the preceding one, and sub-wave 3 is not the shortest. Diagonals can be classified as ending or leading.
The ending diagonal typically appears in Wave 5 of an impulse wave or the last wave of corrective waves. In contrast, the leading diagonal is observed in either Wave 1 of an impulse wave or the Wave A position of a zigzag correction.
3. Zig-Zag Pattern:
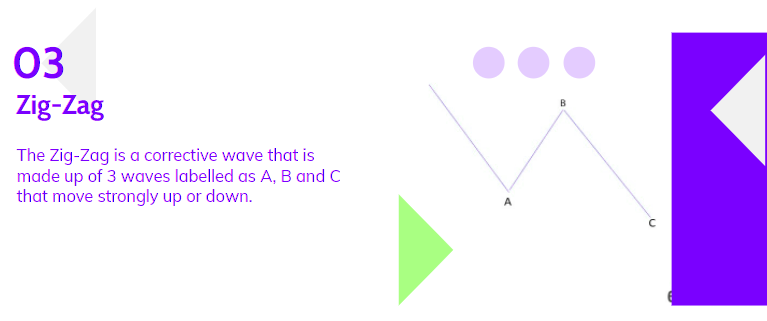
The Zig-Zag, a corrective wave, consists of three waves labeled A, B, and C, moving strongly either up or down. The A and C waves are motive, while the B wave is corrective, typically with three sub-waves.
Zigzag patterns represent sharp declines in a bull rally or advances in a bear rally, significantly correcting the previous Impulse pattern’s price level. Zigzags can also form combinations, known as double or triple zigzags, where two or three zigzags are connected by another corrective wave.
4. Flat Pattern:
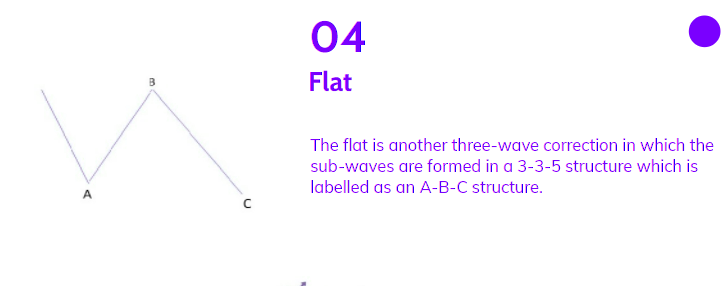
The flat, another three-wave correction, forms in a 3-3-5 structure labeled as an A-B-C structure. In this pattern, both Waves A and B are corrective, while Wave C is motive with 5 sub-waves.
Named for its sideways movement, the flat pattern is often observed within an impulse wave, with the fourth wave typically having a flat, while the second wave rarely does. On technical charts, flats may not appear clear due to variations in their structure.
An expanded flat is a common variation where wave B terminates beyond the beginning of the A wave, and wave C may terminate beyond the start of the B wave. This type of flat is more prevalent in markets compared to normal flats.
5. Triangle Pattern:
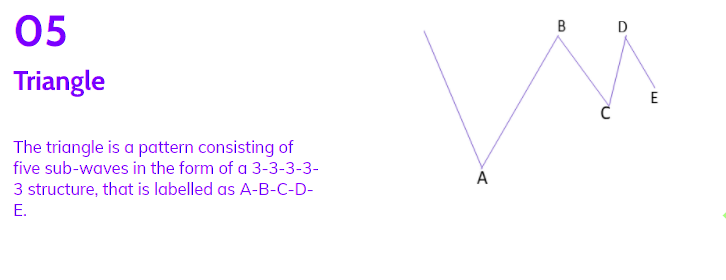
The triangle pattern, labeled as A-B-C-D-E, consists of five sub-waves in a 3-3-3-3-3 structure. This corrective pattern reflects a balance of forces and moves sideways. Triangles can be either expanding, with each sub-wave getting larger, or contracting, forming a wedge.
They can also be symmetrical, descending, or ascending, depending on whether they point sideways, have a flat top while moving up, or a flat bottom while moving down. Sub-waves may form in complex combinations. While theoretically easy to spot, identifying triangles in the market may require some practice.
Bottom Line:
Understanding Elliott Wave Patterns is crucial for predicting market behavior. These patterns, like Motive Waves (Impulse and Diagonal) and Corrective Waves (Zig-Zag, Flat, and Triangle), offer insights into market trends and cycles. While Motive Waves drive the market, Corrective Waves bring balance. It’s essential to grasp the rules governing each pattern and recognize their formations. Whether you’re identifying Impulse Waves’ structured moves or navigating Corrective Waves’ complexities, mastering Elliott Wave Patterns enhances your ability to forecast and trade effectively in the dynamic financial landscape.
Also, To know the Top Bank Nifty Options Strategies, Click Here
Disclaimer: The information provided in this Blog is for educational purposes only and should not be construed as financial advice. Trading in the stock market involves a significant level of risk and can result in both profits and losses. Spider Software & Team does not guarantee any specific outcome or profit from the use of the information provided in this Blog. It is the sole responsibility of the viewer to evaluate their own financial situation and to make their own decisions regarding any investments or trading strategies based on their individual financial goals, risk tolerance, and investment objectives. Spider Software & Team shall not be liable for any loss or damage, including without limitation any indirect, special, incidental or consequential loss or damage, arising from or in connection with the use of this blog or any information contained herein. ![]()