Many traders, especially novices, often overlook the crucial aspect of volume indicator analysis in their technical analysis.
What is Volume?
Volume is the aggregate quantity of a security or item exchanged within a given timeframe, often within a single trading day. For example, traders commonly refer to the quantity of shares traded between a stock’s daily opening and closing as its trading volume. This metric is of paramount importance to technical traders, as it provides essential insights into trading activity, including fluctuations in volume over a period.
Types of Volume Indicators
Volume-weighted average price
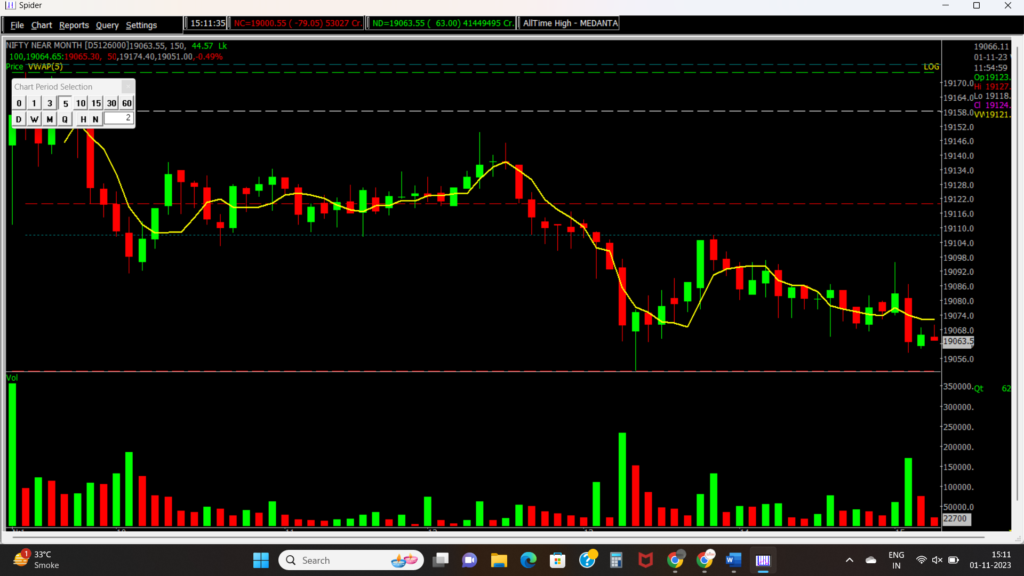
The volume-weighted average price (VWAP) is a metric that calculates the average price at which an asset has been traded during a trading session, taking into account both the price and trading volume.
VWAP is a valuable tool because it provides an accurate representation of the true value at which a security is trading. Traders often rely on VWAP to filter out market noise and gain insights into the price levels at which buyers and sellers are willing to conduct transactions, enabling them to make more informed trading decisions.
A rising VWAP or when the price crosses above the VWAP line typically indicates an uptrend in prices. Conversely, when the VWAP is declining or the price crosses below the VWAP line, it suggests that prices are in a downtrend.
Negative volume index
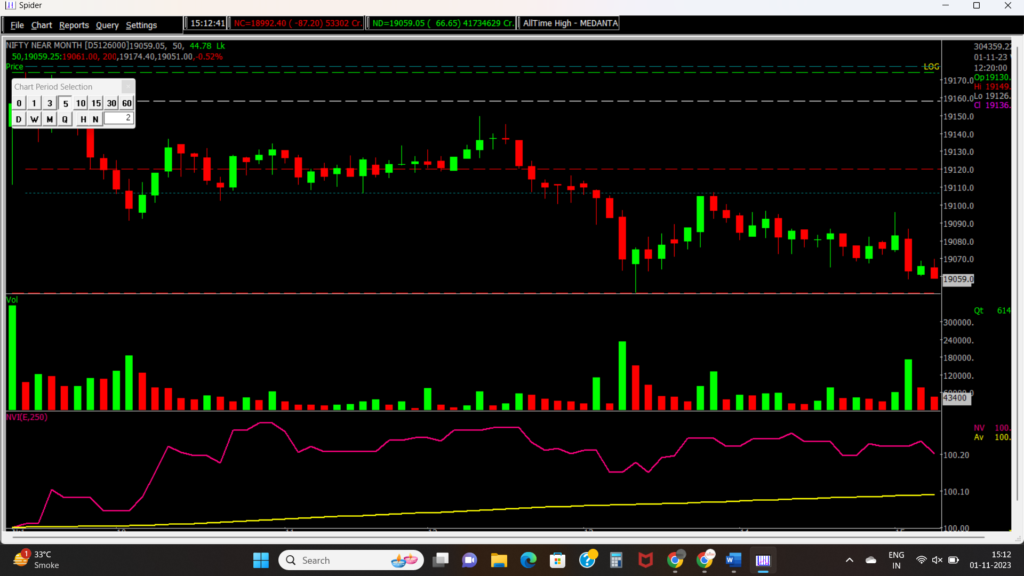
The Negative Volume Index (NVI) is a cumulative indicator that relies on volume changes to identify when smart money is in action. It operates on the premise that smart money is at play on days when trading volume decreases, whereas less sophisticated investors are active when volume increases.
According to this indicator, a bull market is characterized by NVI being above its 255-day Exponential Moving Average (EMA), while a bear market is indicated when NVI falls below this level.
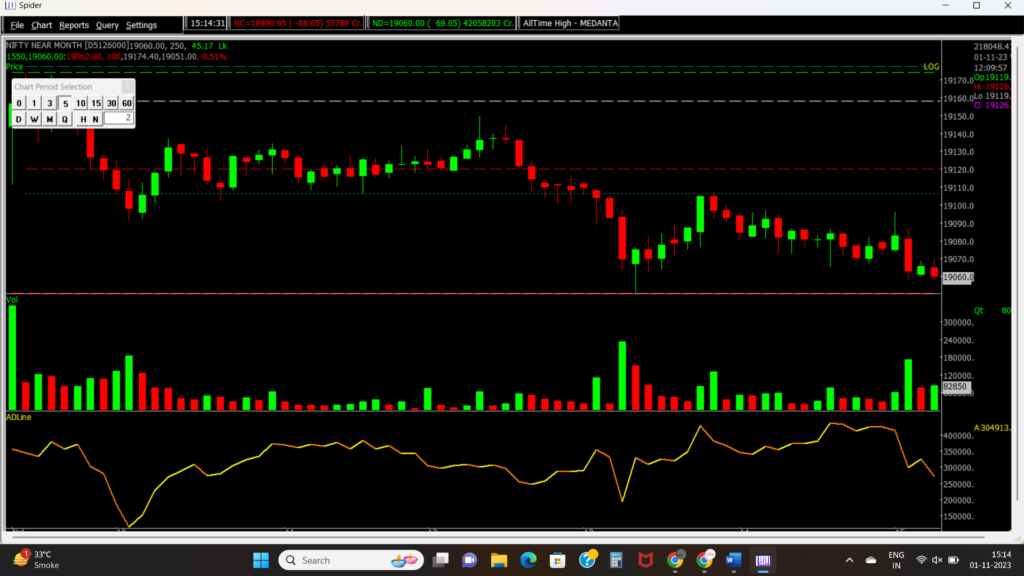
Accumulation/distribution
A substantial positive multiplier, coupled with high volume, indicates robust buying pressure, driving the indicator higher. Conversely, a low negative value alongside high volume signifies significant selling pressure, causing the indicator to decline.
This indicator aims to identify positive or negative divergences in price and volume data, serving as an early warning system for future price movements.
A trader who accumulates stock is essentially buying stock, while a trader who offers stock to the market is selling it. Therefore, the accumulation/distribution indicator assesses the balance between supply and demand, which ultimately influences price movements.
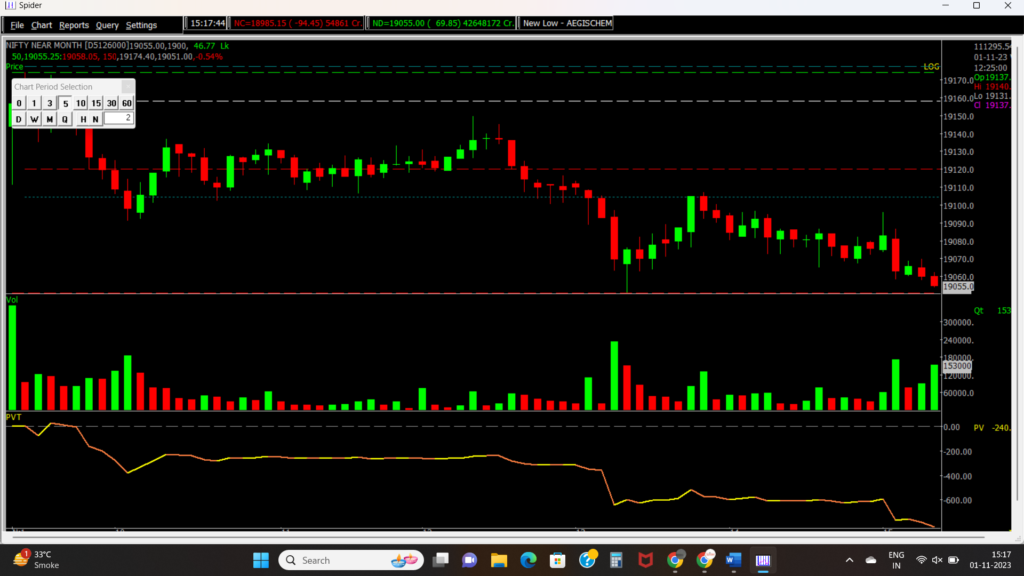
Volume Price Trend Indicator
The Volume Price Trend (VPT) indicator is a volume-based tool that aids in determining both a stock’s price direction and the strength of price changes.
This indicator consists of a cumulative volume line that adjusts by adding or subtracting a multiple of the percentage change in a share price’s trend and the current volume, depending on whether the security is moving upward or downward.
VPT is similar to the On-Balance Volume (OBV) indicator, as it calculates cumulative volume and offers traders insights into a security’s money flow.
Interpretations of the VPT can be summarized as follows:
- An increase in price and volume confirms an upward price trend.
- A decrease in price and volume confirms a downward price trend.
- An increase in price accompanied by decreasing or stable volume suggests a negative divergence, implying that the downward price movement is weakening and may reverse.
- A decrease in price accompanied by increasing or stable volume suggests a positive divergence, indicating that the upward price movement is weakening and may reverse.
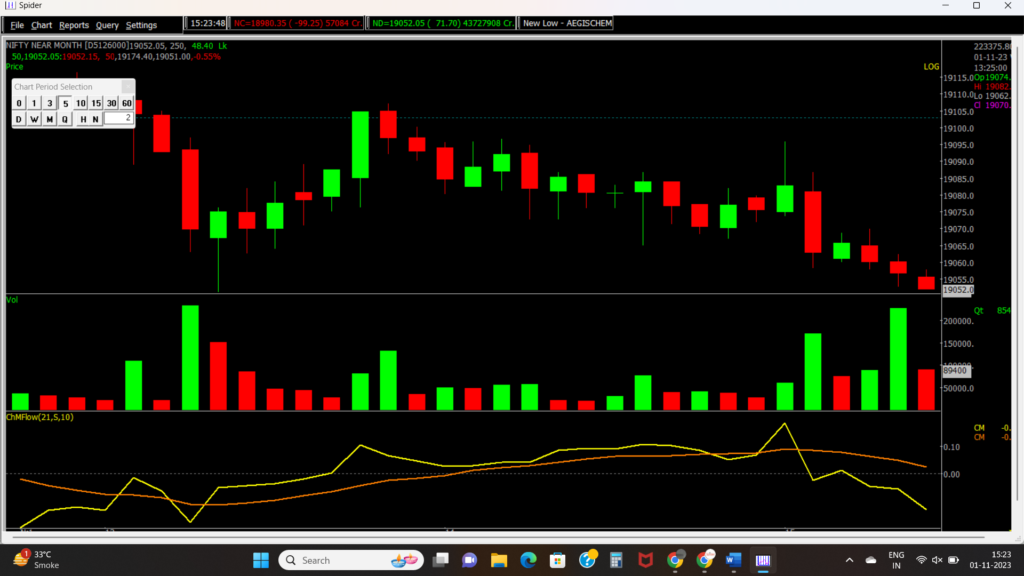
Chaikin Money Flow Indicator
CMF calculates Money Flow Volume for a designated look-back period, typically 20 or 21 days, and fluctuates above and below the zero line, functioning similarly to an oscillator.
According to this indicator, when the closing price is closer to the high, it suggests more accumulation of the asset, while when the closing price is closer to the low, it indicates more distribution.
Interpretations of the CMF can be summarized as follows:
- A CMF value above the zero line signifies market strength, while a value below the zero line suggests market weakness.
- Traders should wait for the CMF to confirm the breakout direction of price action. For instance, when the price breaks upward through resistance, waiting for the CMF to have a positive value can confirm the breakout direction.
- A CMF sell signal occurs when the price makes a higher high in overbought zones, and the CMF diverges with a lower high, which is termed as a negative divergence.
- A CMF buy signal occurs when the price makes a lower low, and the CMF diverges with a higher low, indicating positive divergence.
An Opportunity to Learn Live Trading and Training on Monthly Expiry by Clicking Here

Also check out the Upcoming IPO’s.
If you’d like to know how we analyze the market and provide accurate levels every day. then click on the Free Demo button below and change your trading life for good. 5X returns are possible in options trading If you have Spider Software in your trading system.
Disclaimer: The information provided in this Blog is for educational purposes only and should not be construed as financial advice. Trading in the stock market involves a significant level of risk and can result in both profits and losses. Spider Software & Team does not guarantee any specific outcome or profit from the use of the information provided in this Blog. It is the sole responsibility of the viewer to evaluate their own financial situation and to make their own decisions regarding any investments or trading strategies based on their individual financial goals, risk tolerance, and investment objectives. Spider Software & Team shall not be liable for any loss or damage, including without limitation any indirect, special, incidental or consequential loss or damage, arising from or in connection with the use of this blog or any information contained herein.