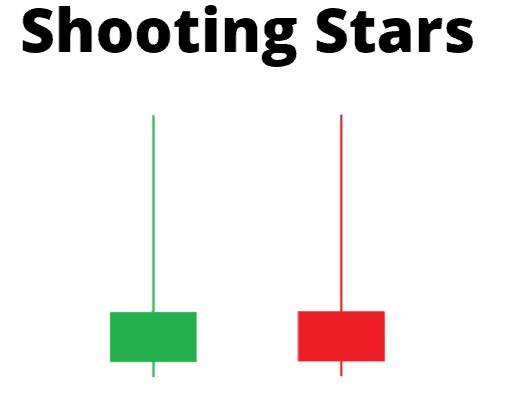
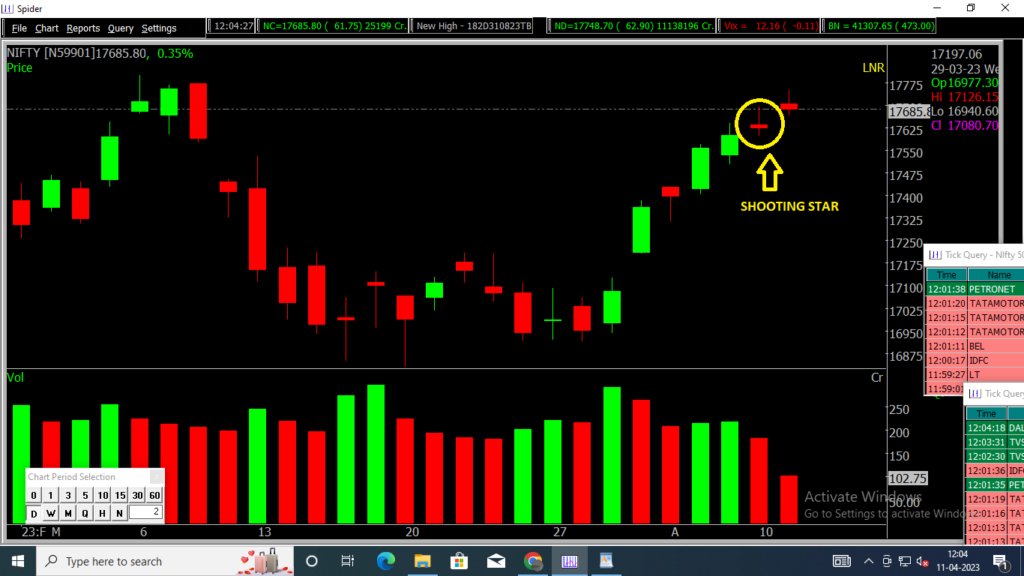
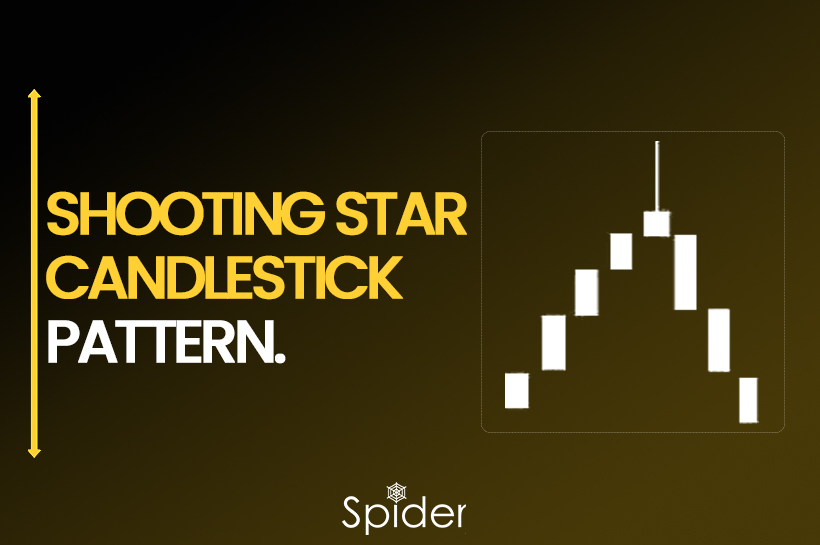
A bearish candlestick pattern known as a shooting star is characterized by a long upper shadow and an absence of a lower shadow.
what is Shooting Star Candlestick Pattern?
The shooting star pattern typically forms after an uptrend and is characterized by a small body near the bottom of the candlestick, with a long upper shadow or wick that is significantly longer than the body. The lower shadow is either absent or very short, giving the pattern its name as it resembles a shooting star.
The shooting star pattern suggests that buyers initially pushed the price higher, but sellers regained control and pushed the price down, resulting in a long upper shadow. The small body near the bottom of the candlestick indicates indecision in the market, with the closing price near the opening price.

Formation of Shooting Star Candlestick Pattern:
- A Shooting Star candlestick pattern is a bearish reversal pattern that often appears at the end of an uptrend.
- To form this pattern, the candlestick should have a small real body that is preferably red or black, and the upper shadow should be at least twice as long as the real body. Additionally, the lower shadow should be very small or non-existent.
- The pattern should occur after a prolonged uptrend.
- The Shooting Star candlestick pattern is an indication of a potential trend reversal. It suggests that the buying pressure that drove the price up during the uptrend has weakened, and the sellers may be starting to take control.
- Traders often look for confirmation of the pattern by checking for a bearish candlestick formation on the following day.
How to Use the Shooting Star candlestick pattern?
Confirmation: Traders often seek confirmation of the Shooting Star pattern by observing the price action the day after the pattern formation. A bearish candlestick formation on the following day can confirm the reversal signal, while a bullish candlestick formation can weaken or negate the reversal signal.
Entry signal: Traders may use the Shooting Star pattern as an entry signal to take short positions or exit long positions. They can enter a short trade when the Shooting Star pattern forms after an uptrend, as it suggests a potential trend reversal.
Stop-loss placement: Traders can put a stop-loss order above the high of the Shooting Star pattern since it can act as a resistance level. This can help limit potential losses if the reversal signal turns out to be false.
Take-profit target: Traders can use various technical analysis tools, such as support and resistance levels, trendlines, or Fibonacci retracements, to identify potential take-profit targets. They can exit their short position or take profits when the price reaches the target level.
It’s important to note that the Shooting Star pattern is not fool proof. Instead, it should always be combined with other technical indicators and risk management strategies to make informed trading decisions.

FAQ
What does shooting star mean in candlestick?
Shooting stars indicate a potential price top and reversal. The shooting star candle becomes most effective when it forms after a series of three or more consecutive rising candles with higher highs. It may also occur during a period of overall rising prices, even if a few recent candles were bearish.
How accurate is shooting star candlestick?
Traders can reliably identify a bearish reversal, especially when a shooting star candlestick appears near the resistance level. Considering the shooting star candlestick in isolation should be avoided. Confirming the signals using technical indicators is crucial.
Can a shooting star be bullish?
It’s essential to be aware that not all shooting star candlestick patterns are bearish. Some shooting stars may appear green, indicating a bullish version called inverted hammer candlesticks, where the market opened lower but closed higher.
Disclaimer: The information provided in this Blog is for educational purposes only and should not be construed as financial advice. Trading in the stock market involves a significant level of risk and can result in both profits and losses. Spider Software & Team does not guarantee any specific outcome or profit from the use of the information provided in this Blog. It is the sole responsibility of the viewer to evaluate their own financial situation and to make their own decisions regarding any investments or trading strategies based on their individual financial goals, risk tolerance, and investment objectives. Spider Software & Team shall not be liable for any loss or damage, including without limitation any indirect, special, incidental or consequential loss or damage, arising from or in connection with the use of this blog or any information contained herein.


