
Triple Top and Triple Bottom are reversal chart patterns. Triple Top indicates a bearish trend change, while Triple Bottom signals a bullish trend change. They are variations of the Double Top and Double Bottom patterns.
What is Triple Top Pattern?
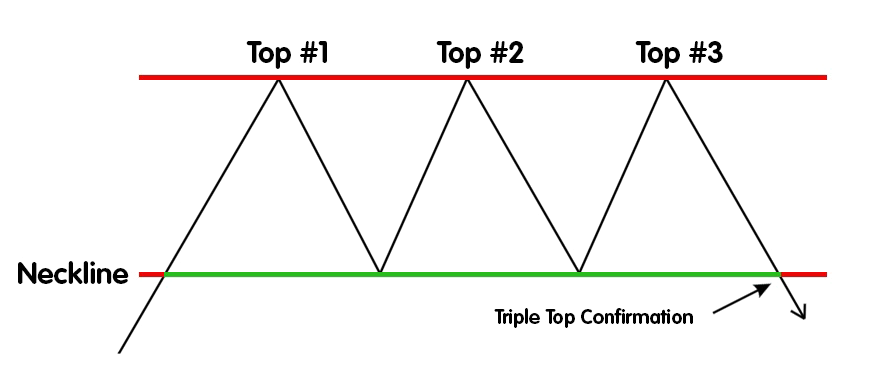
The triple-top chart pattern is a signal of a potential trend reversal from upward to downward. It forms when there are three consecutive peaks above a support level. The pattern is completed when the prices retrace to the support level after forming the third peak. A confirmed trend reversal occurs when the prices break below the support level.
What is Triple Bottom Pattern?
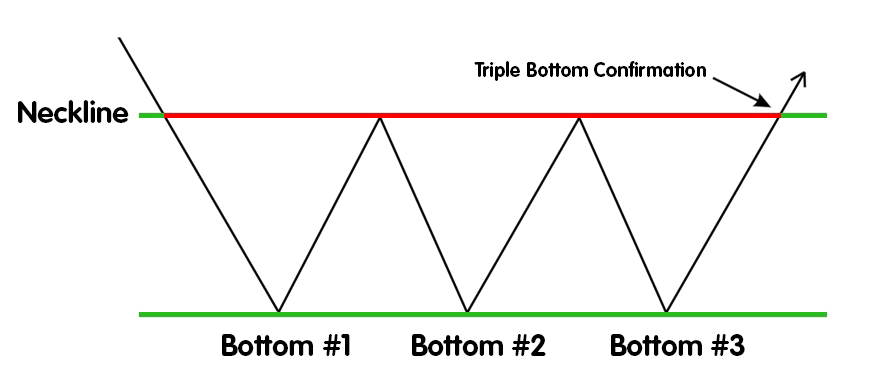
The triple bottom chart pattern is a bullish reversal pattern that occurs after a downtrend. It consists of three consecutive lows below a resistance level or neckline. The pattern is completed when the prices retrace to the neckline after forming the third low. A confirmed trend reversal is indicated when the prices break above the neckline or resistance level.
How to Analyze the Patterns?
Analyzing the Triple Top Pattern:
Firstly, look for three peaks that form around the same level, indicating resistance. It’s important to confirm that the pattern is forming after an uptrend. Next, draw a line connecting the lows between the peaks to form the neckline, which represents a support level.
Pay attention to price action and wait for prices to break below the neckline, confirming the pattern and signaling a potential bearish reversal. You can estimate the potential price decline by measuring the vertical distance between the peaks and projecting it below the neckline.
Additionally, consider using other technical analysis tools like volume, oscillators, or trend lines to support your analysis. Remember to wait for confirmation before making any trading decisions based on the Triple Top pattern.
And also, for a Triple Top chart pattern, it is recommended to set the stop loss at the level of the third peak in the pattern. While the Target Price should be the same as the distance between Neckline and the Tops.
Triple Top pattern on PBA Infrastructure Ltd in Daily charts
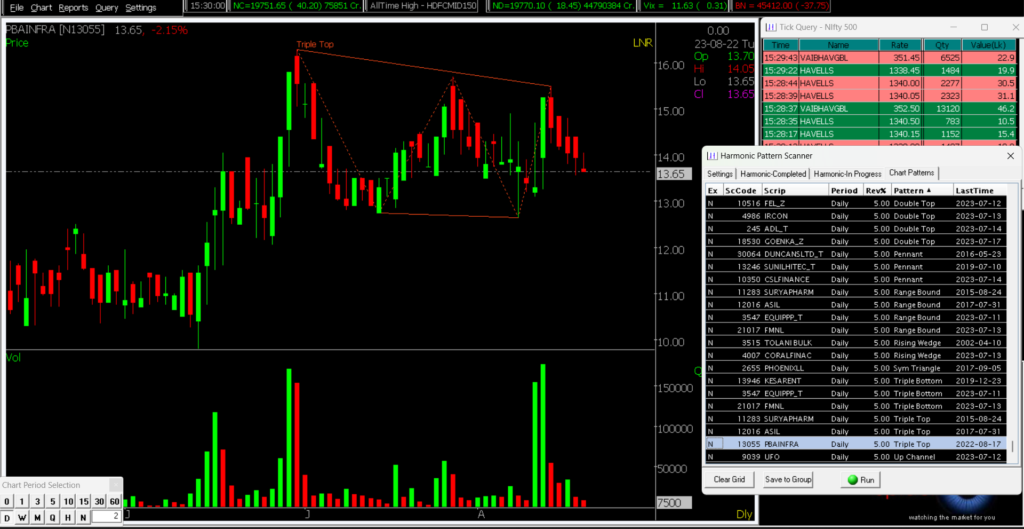
A Triple Top pattern has formed on PBA Infra’s daily chart. The three tops follow a trendline, acting as resistance. The pattern indicates a strong resistance level that has held against three tests by the price. This suggests that after reaching the trendline, there is less buying and more selling pressure. If the third top had broken the resistance (indicating more demand), it would have gone above the resistance level. Traders should confirm the pattern before entering a trade and implement proper risk management to reduce potential losses.
Analyzing the Tripple Bottom Pattern:
When analyzing the Triple Bottom pattern, you can follow a straightforward process. Begin by identifying three distinct lows that form around the same level, indicating potential support. Confirm that the pattern occurs after a downtrend, which suggests a possible reversal.
Next, draw a line connecting the highs between the lows to create the neckline, representing a resistance level. Monitor price action closely, looking for prices to break above the neckline. This breakout confirms the pattern and signals a bullish reversal.
To estimate the potential price increase, measure the vertical distance between the lows and project it above the neckline. Additionally, consider using other technical analysis tools like volume, oscillators, or trend lines to complement your analysis.
Keep in mind that it is crucial to wait for confirmation before making any trading decisions based on the Triple Bottom pattern. Also, when dealing with the Triple Bottom pattern, it is advisable to set the stop loss at the level of the third bottom within the pattern. The Price Target should be equivalent to the distance between the neckline and the bottoms.
Tripple Bottom pattern on EQUIPPP_T in Daily charts
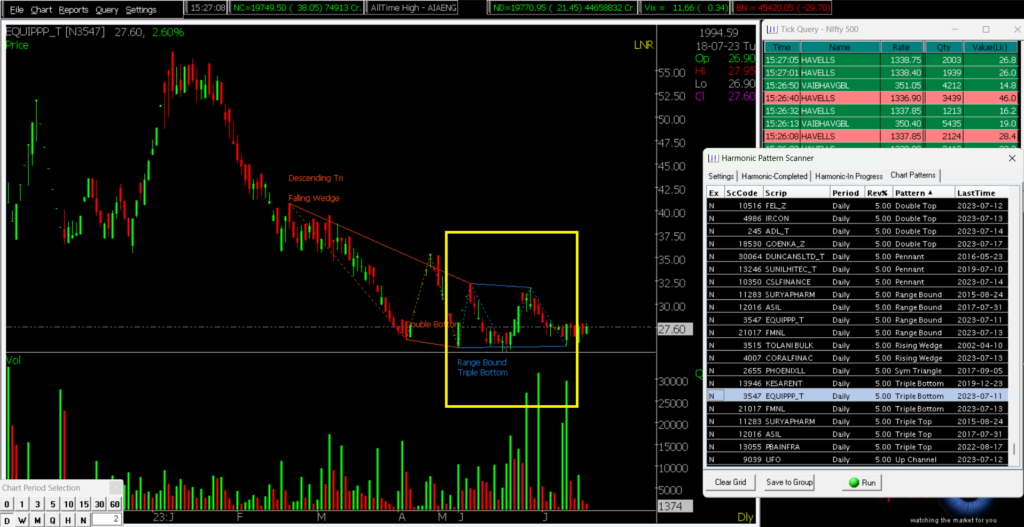
EQUIPPP_T may have a Triple Bottom pattern in its daily chart. Three bottoms at similar levels form strong support. Selling pressure may be easing, and buyers could support the price. Confirmation: The previous two bottoms take the support on the exact demand line, indicating bullish sentiment and potential price rise. Traders should confirm the pattern and manage risks carefully.
To Summarize
To sum up, Triple Top and Triple Bottom patterns are reversal patterns seen on charts. A Triple Top pattern forms after an uptrend, indicating a potential bearish reversal. On the other hand, a Triple Bottom pattern forms after a downtrend and suggests a potential bullish reversal. Traders adhere to specific rules when trading these patterns.
Learn how utilizing the Momentum Strategy can boost your intra-day trading skills and take your trading abilities to new heights. Click Here To Register

Also, if want to how Commodity & Currency Trading can be beneficial? Click here to Know
Disclaimer: The information provided in this Blog is for educational purposes only and should not be construed as financial advice. Trading in the stock market involves a significant level of risk and can result in both profits and losses. Spider Software & Team does not guarantee any specific outcome or profit from the use of the information provided in this Blog. It is the sole responsibility of the viewer to evaluate their own financial situation and to make their own decisions regarding any investments or trading strategies based on their individual financial goals, risk tolerance, and investment objectives. Spider Software & Team shall not be liable for any loss or damage, including without limitation any indirect, special, incidental or consequential loss or damage, arising from or in connection with the use of this blog or any information contained herein.