
In the stock market, traders use the Acceleration Oscillator as a technical analysis tool to measure the rate of change of momentum of a security’s price.
The Development of Accelerator Oscillator Indicator

Bill Williams, a well-known trader, and author created the Acceleration Oscillator indicator because he felt that traditional technical analysis tools did not capture the market dynamics fully.
He developed the Awesome Oscillator to compare current and overall market momentum and then used it to make the Acceleration Oscillator.
A histogram shows the difference between the Awesome Oscillator and a 5-period simple moving average of the Awesome Oscillator.
This indicator identifies changes in momentum that can signal trend reversal or continuation and filters out market noise to provide a clearer picture of momentum.
What Is Acceleration Oscillator Indicator?
In the stock market to measures the momentum rate of change of a security’s price, the Acceleration Oscillator tool used, which helps trader in technical analysis.
By analyzing the differences between the current price and the midpoint of the high-low range, traders can plot these values as a histogram to determine potential buying or selling opportunities.
The Acceleration Oscillator is a valuable tool for traders seeking to identify trend reversals or continuations in the stock market and can aid in generating trading signals and making informed decisions.
The Formula To Calculate Acceleration Oscillator Indicator.
It is calculated by subtracting a 5-period simple moving average (SMA) from a 34-period SMA.
The Accelerator Oscillator is a technical analysis tool used by traders to identify potential buying or selling opportunities based on the momentum of a security’s price.
It is calculated by subtracting a 5-period Simple Moving Average (SMA) from a 34-period SMA.
The formula for the Accelerator Oscillator is:
AC = SMA(5) of (Median Price) – SMA(34) of (Median Price)
where:
AC = Acceleration Oscillator SMA = Simple Moving Average Median Price = (High + Low) / 2
To calculate the Accelerator Oscillator, you first need to calculate the Median Price for each period, which is the average of the High and Low price for that period.
Then, you calculate the 5-period SMA and the 34-period SMA of the Median Price. Finally, you subtract the 5-period SMA from the 34-period SMA to get the Accelerator Oscillator value.
Traders can plot the Accelerator Oscillator values as a histogram or line chart, which helps them identify potential buying or selling opportunities based on the momentum of the security’s price.
The Accelerator Oscillator is a valuable tool for traders seeking to identify trend reversals or continuations in the stock market and can aid in generating trading signals and making informed decisions.
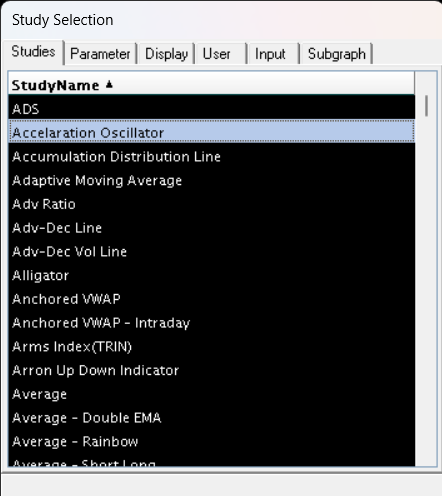
Steps To Apply Acceleration Oscillator Indicator In Spider Software.
Step 1:
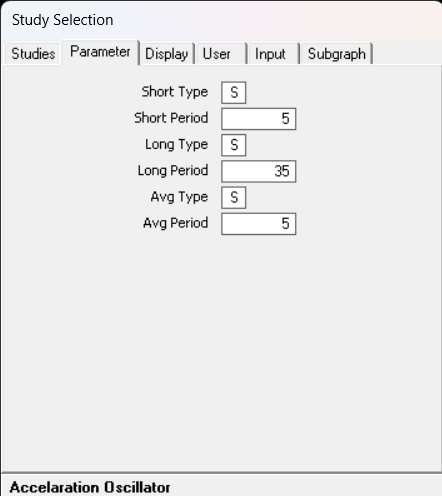
Step 2:
Step 3:
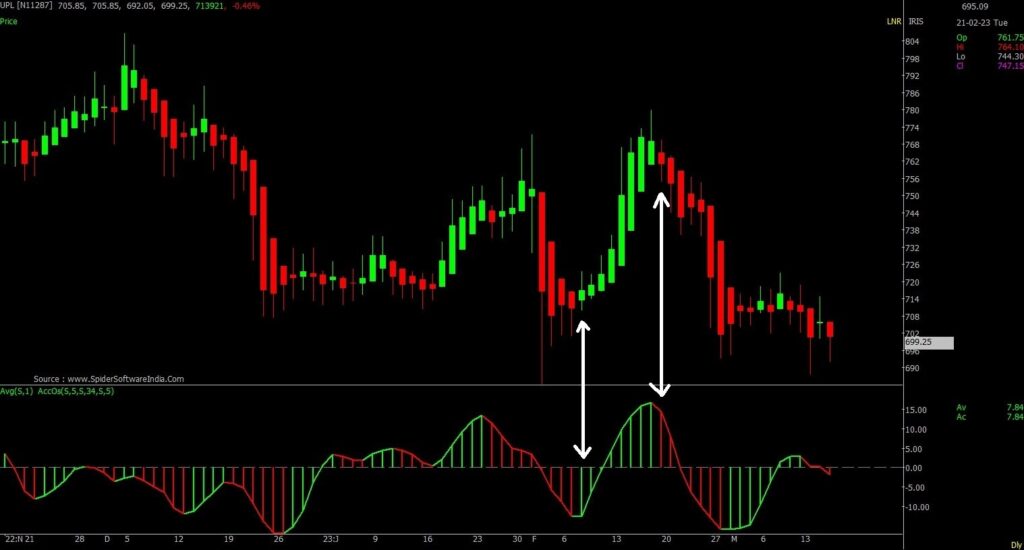
For example, in the chart above, the selected stock is “UPL”.
Conclusion:
Bill Williams created the Accelerator Oscillator to help traders detect trend changes early, giving them an advantage.
To gain confidence and proficiency in this strategy, it’s best to try it on a demo trading account with real market conditions and no risk.
Williams emphasized that the the right mindset is necessary for successful trading and indicators are only part of the story.
Disclaimer: The information provided in this Blog is for educational purposes only and should not be construed as financial advice. Trading in the stock market involves a significant level of risk and can result in both profits and losses. Spider Software & Team does not guarantee any specific outcome or profit from the use of the information provided in this Blog. It is the sole responsibility of the viewer to evaluate their own financial situation and to make their own decisions regarding any investments or trading strategies based on their individual financial goals, risk tolerance, and investment objectives. Spider Software & Team shall not be liable for any loss or damage, including without limitation any indirect, special, incidental or consequential loss or damage, arising from or in connection with the use of this blog or any information contained herein. ![]()