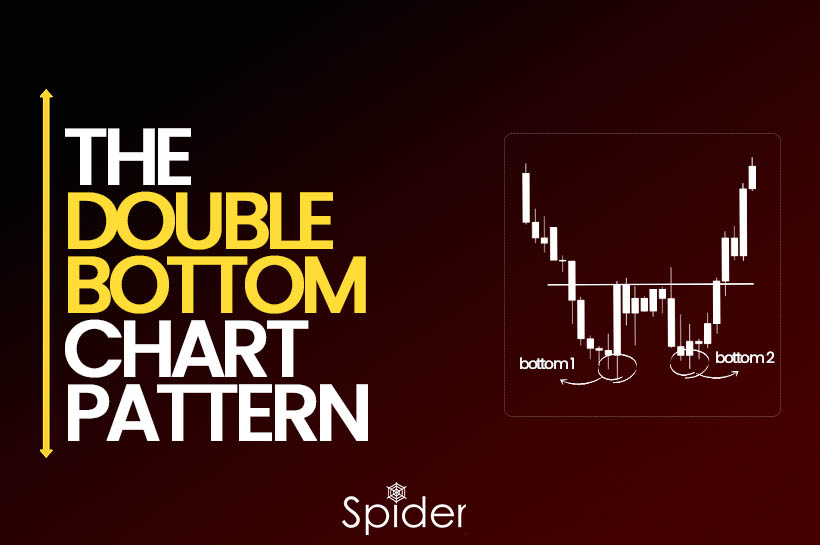
The Double Bottom pattern is a bullish chart pattern that is commonly used in technical analysis.
What is Double Bottom pattern?
The Double Bottom pattern is a bullish chart pattern that is commonly used in technical analysis. This pattern is formed when the price of a stock or asset reaches a low point, rebounds upwards, falls to a similar low point, and then rebounds upwards again. These two lows are typically separated by a period of time during which the price may move sideways or display some other temporary movement. The two bottoms should be roughly at the same level, which creates a support level that the price has failed to break through twice.
This pattern is considered to be bullish because it implies that the selling pressure that led to the price falling to the first low has been exhausted, and buyers are stepping in to support the price. The price bouncing up again after reaching the second low confirms the bullish sentiment and indicates that the price is likely to continue increasing.

How to use Double Bottom Pattern?
Traders and analysts often use the following steps to utilize the Double Bottom pattern in trading:
Identify the pattern: Look for two bottoms that are roughly at the same level, with a clear low point in between them. The pattern should be formed over a period of time, typically several weeks or months, and the price should not have broken through the support level formed by the two bottoms.
Confirm the pattern: Look for confirmation signals that the pattern is valid, such as an increase in trading volume when the price breaks above the resistance level created by the pattern. This can help confirm that buyers are stepping in and that the price is likely to continue rising.
Enter the trade: Once the pattern is confirmed, traders may consider entering a long position by buying the asset or taking other bullish positions, such as buying call options. It’s advisable to set a stop-loss order to limit potential losses if the price doesn’t continue to rise as expected.
Manage the trade: As the price rises, traders may consider taking profits or adjusting their stop-loss order to lock in gains and protect their position. Setting a price target based on technical analysis or other factors may also help guide trading decisions.
Monitor the pattern: Traders should watch for any signs that the pattern is no longer valid, such as a break below the support level or a decrease in trading volume. This can signal a change in market sentiment and may require traders to adjust or exit their position.
Placing Stops and Taking Profits in Double Bottom Pattern
When trading the Double Top pattern, it’s important to have a plan for managing risk and taking profits. Here are some considerations for placing stops and taking profits:
Placing Stops:
A stop-loss order can be placed below the support level formed by the two tops. This level represents a potential price floor, and a break below it could invalidate the pattern and lead to further losses.
Alternatively, traders may choose to set the stop-loss order below each subsequent low point as the price moves higher, allowing them to lock in profits and limit potential losses.
Taking Profits:
One approach is to set a profit target based on the height of the pattern. This can be calculated by subtracting the support level from the highest point of the pattern and adding the result to the breakout level. This approach allows traders to take advantage of the potential price move resulting from the pattern.
Another approach is to use technical indicators or other analysis to identify potential resistance levels where the price may struggle to move higher. This can help traders identify potential exit points for their positions.
Double Bottom chart pattern on Reliance in Daily charts

Reliance Industries Limited (Reliance) is exhibiting a potential Double Bottom chart pattern in its daily chart. Two bottoms have formed at a similar level, with a consolidation period in between. These bottoms have created a strong support level that has held up against two tests by the price. The pattern suggests that selling pressure may have been exhausted and buyers may be stepping in to support the price. Confirmation of the pattern would occur if the price breaks above the resistance level formed by the two tops, indicating a bullish sentiment and the potential for further price increases. However, traders should always confirm the pattern before entering a trade and implement proper risk management measures to mitigate potential losses.
Nifty 50 can form Double Bottom in Daily charts.

If this type of candle is formed in Nifty 50 daily chart and the next candle break the high of that candle it will form double bottom .
Disclaimer:
The information provided in this Blog is for educational purposes only and should not be construed as financial advice. Trading in the stock market involves a significant level of risk and can result in both profits and losses. Spider Software & Team does not guarantee any specific outcome or profit from the use of the information provided in this Blog. It is the sole responsibility of the viewer to evaluate their own financial situation and to make their own decisions regarding any investments or trading strategies based on their individual financial goals, risk tolerance, and investment objectives. Spider Software & Team shall not be liable for any loss or damage, including without limitation any indirect, special, incidental or consequential loss or damage, arising from or in connection with the use of this blog or any information contained herein


Recent Comments on “Major Potential Trend Reversals with Double Bottoms”