In today’s Stock Market, amid volatility, Nifty and Sensex ended close flat; mid and small-cap sectors outperformed.
Stock Market Nifty Chart Prediction.
Closing the highly volatile session on January 1, Indian benchmark indices saw a slight uptick, with Nifty hovering around 21,750. The Sensex concluded with a marginal gain of 31.68 points (0.04 percent) at 72,271.94, while the Nifty rose by 10.50 points (0.05 percent) to 21,741.90. Among the top Nifty gainers were Nestle India, Adani Enterprises, Adani Ports, Tech Mahindra, and Wipro, while Eicher Motors, Bharti Airtel, M&M, Bajaj Auto, and HDFC Bank were among the losers. In the sectoral landscape, healthcare and PSU Bank witnessed a 0.5 percent increase, whereas the bank index saw a 0.5 percent decline. The broader indices, BSE Midcap and Smallcap, outperformed, each adding 0.5 percent.
Stock Prediction for 02nd Jan 2023
1) ADANIENT: Good Above 2925, Weak Below 2880
2) ICICIPRULI: Good Above 535, Weak Below 530
3) CANBK: Good Above 445, Weak Below 440
4) OBEROIRLTY: Good Above 1461, Weak Below 1440
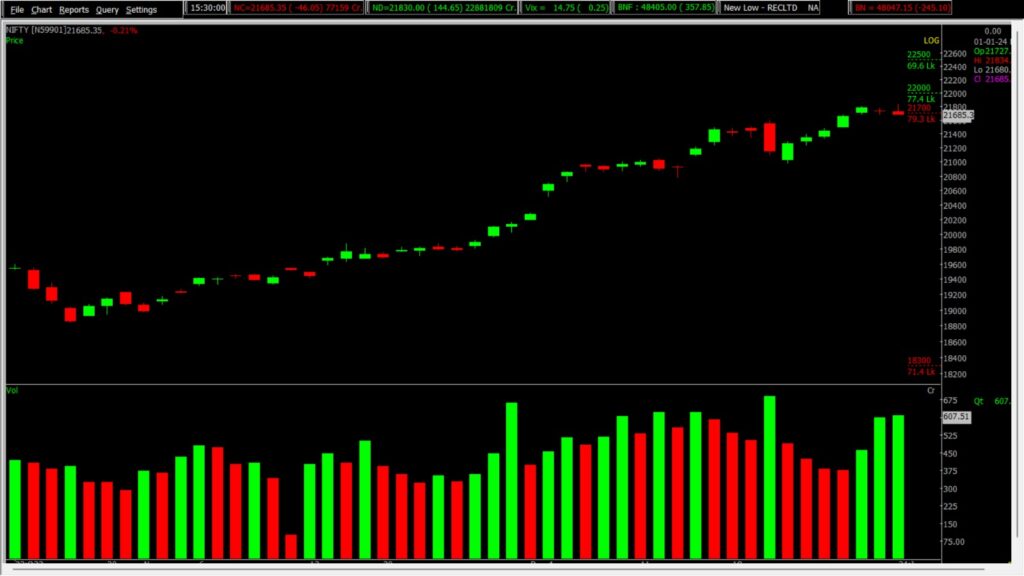
Prediction For Tuesday NIFTY can go up if it goes above 22000 or down after the level of 21600 but all depends upon the Global cues.
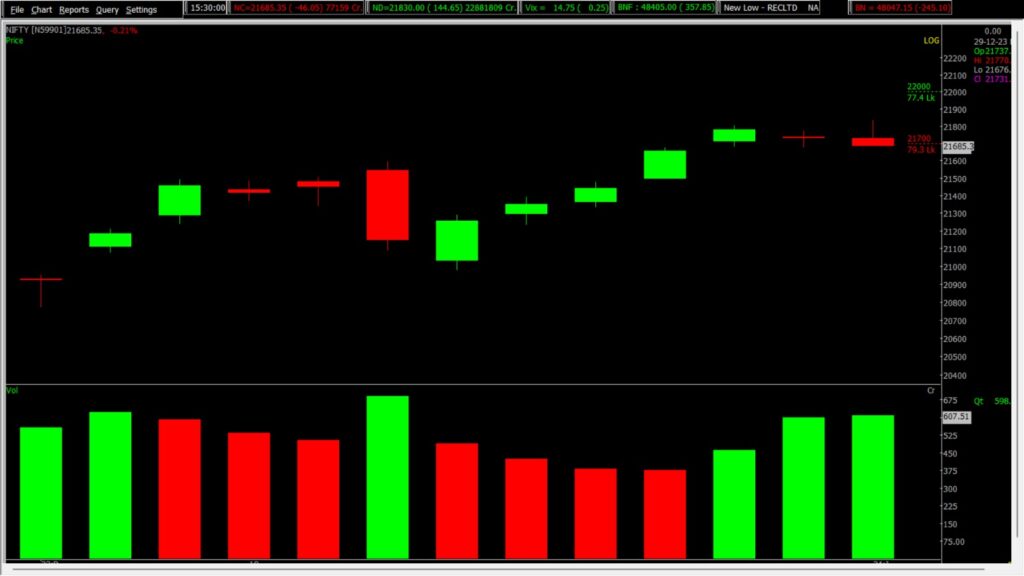
Today, after a neutral start, the Nifty exhibited erratic trading behavior, achieving a fresh all-time peak of 21,834.35. However, it later corrected from these elevated levels, concluding the session just above the 21,700 support mark. The index finds support in the 21,600-21,500 zone. Examining the Open Interest (OI) data, the call side highlights the highest OI at 22,000.
| Highest Call Writing at | 22000 (77.4 Lakhs) |
| Highest Put Writing at | 21500 (79.3 Lakhs) |
Nifty Support and Resistance
| Support | 21600, 21500 |
| Resistance | 22000, 22200 |
Bank Nifty Daily Chart Prediction
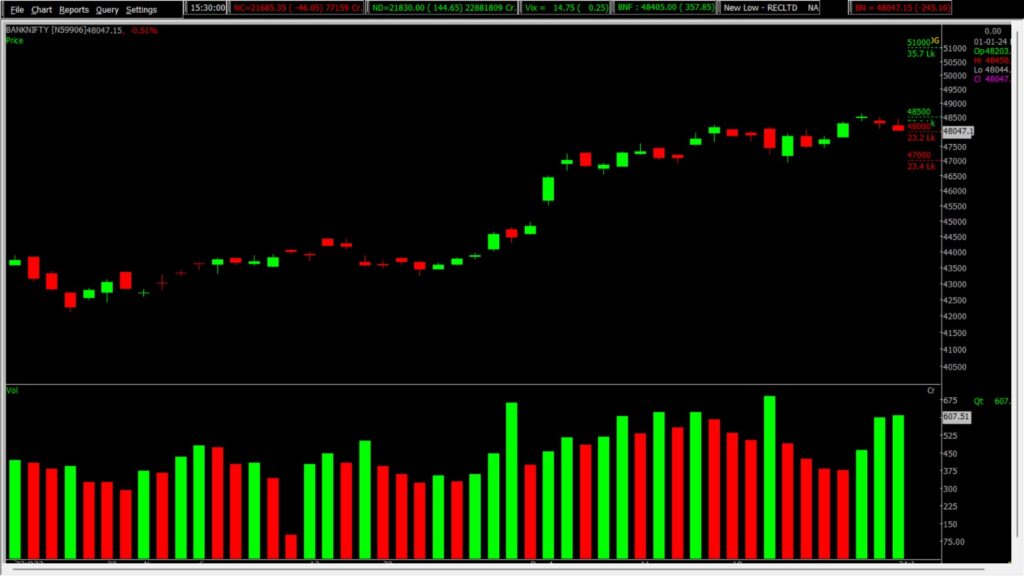
Prediction For Tuesday BANK NIFTY can go up if it goes above 48500 or down after the level of 48000 but it all depends upon the Global cues.
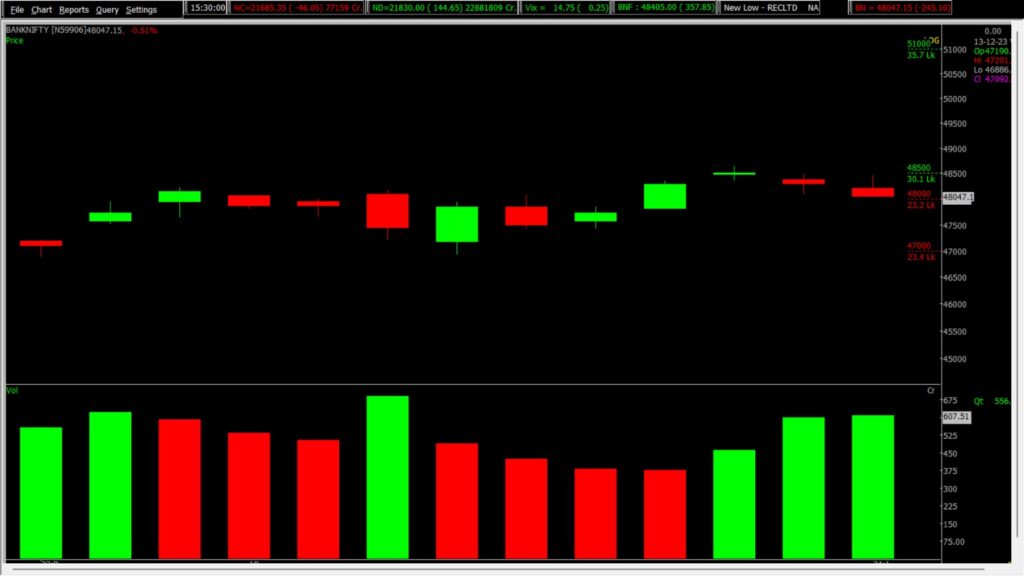
Bank Nifty experienced a retreat, finding support around 48,000 and ultimately closing above this identified support level. The index concluded the session with a negative performance, marking a 0.12 percent decline to settle at 48,234.30. Notably, Bank Nifty’s support levels are established at 48,000-47,900, while resistance is noted at 48,500 and 48,600 levels.
| Highest Call Writing at | 48500 (36.4 Lakhs) |
| Highest Put Writing at | 48000 (23.2 Lakhs) |
Bank Nifty Support and Resistance
| Support | 48000, 47,900 |
| Resistance | 48,500 48,600 |
Also, check our Article on the most common Indicators used in Swing Trading.
If you’d like to know how we analyze the market and provide accurate levels every day. then click on the Free Demo button below and change your trading life for good. 5X returns are possible in options trading If you have Spider Software in your trading system.
Disclaimer: The information provided in this Blog is for educational purposes only and should not be construed as financial advice. Trading in the stock market involves a significant level of risk and can result in both profits and losses. Spider Software & Team does not guarantee any specific outcome or profit from the use of the information provided in this Blog. It is the sole responsibility of the viewer to evaluate their own financial situation and to make their own decisions regarding any investments or trading strategies based on their individual financial goals, risk tolerance, and investment objectives. Spider Software & Team shall not be liable for any loss or damage, including without limitation any indirect, special, incidental or consequential loss or damage, arising from or in connection with the use of this blog or any information contained herein.