In the Stock Market Today, Nifty dips below 22,000, Sensex sheds 450 points due to losses in banking, FMCG, and oil & gas sectors.
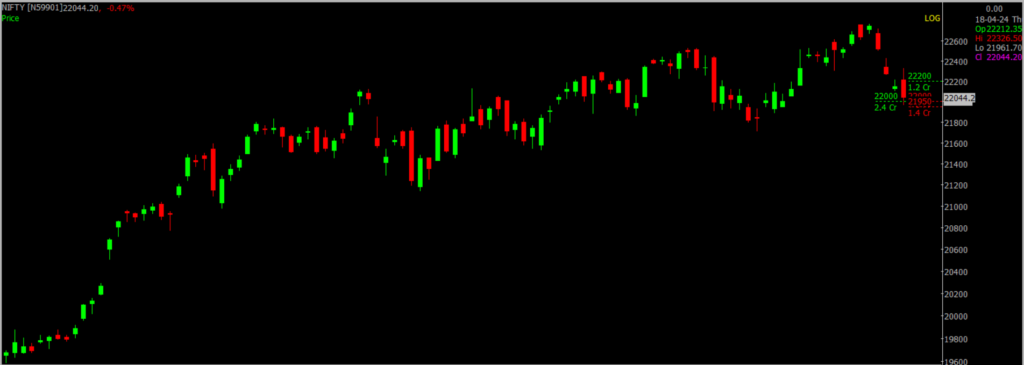
Stock Market Nifty Chart Prediction.


On April 18, Sensex fell by 379.67 points, to 72,564.01, while the Nifty dropped 126.40 points, closing at 22,021.50. In the broader market, 2,359 shares moved higher, -908 shares fell, and 91 shares remained unchanged.
Top Nifty gainers: Bharti Airtel, Power Grid Corporation, Hindalco Industries, Bajaj Auto and LTIMindtree,
Top Nifty Losers: Apollo Hospitals, Nestle India, ONGC, Adani Enterprises and Titan Company.
All sectoral indices, apart from telecom and media, are currently trading lower.
BSE midcap index fell by 0.4% and smallcap index closed unchanged.
Stock Prediction for 19th April 2024.
| STOCK | Good Above | Weak Below |
| APOLLOTYRE | 482 | 476 |
| CUMMINSIND | 3136 | 3108 |
| MARUTI | 12500 | 12410 |
| TATASTEEL | 163 | 159 |
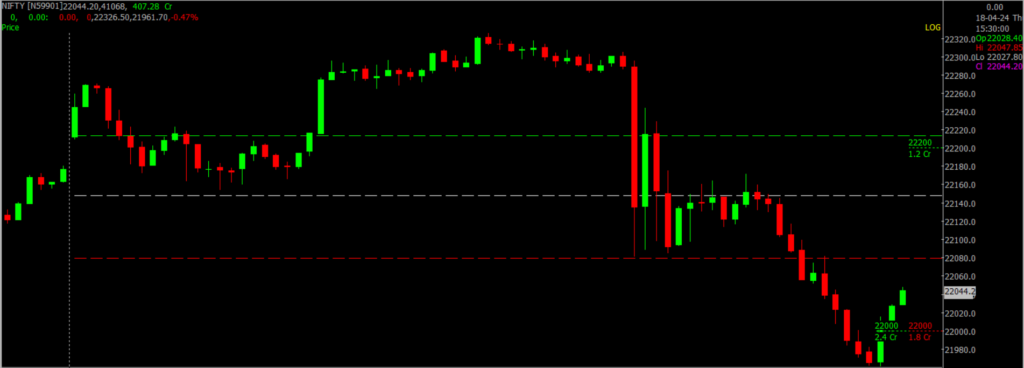
Prediction For Friday, NIFTY can go up if it goes above 22,200 or down after the level of 22,000 but all depends upon the Global cues.
Nifty started the day with a gap up, but experienced a sharp selloff in the latter half, ultimately closing down by approximately 152 points. Resistance was evident in the 22,200 to 22,300 range, while the Nifty is now nearing the lower support zone between 22,000 and 21,950. This will be a key level to monitor in the upcoming trading sessions.
| Highest Call Writing at | 22,200 (2.2 Crore) |
| Highest Put Writing at | 22,000 (1.8 Crore) |
Nifty Support and Resistance
| Support | 22,000, 21,950 |
| Resistance | 22,200, 22,300 |
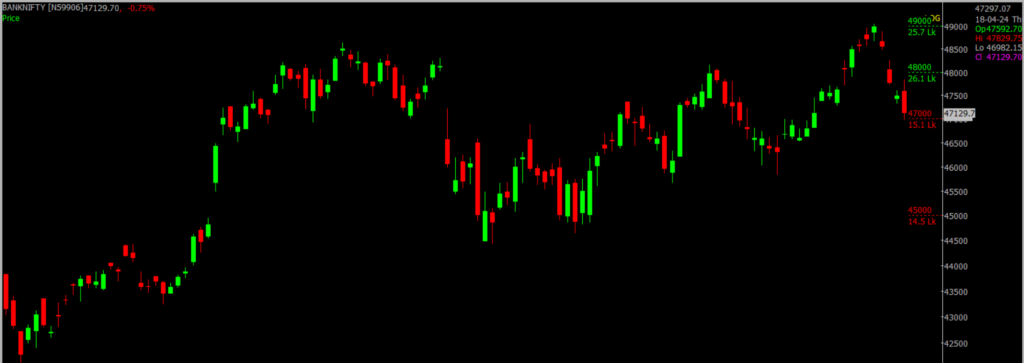
Bank Nifty Daily Chart Prediction.


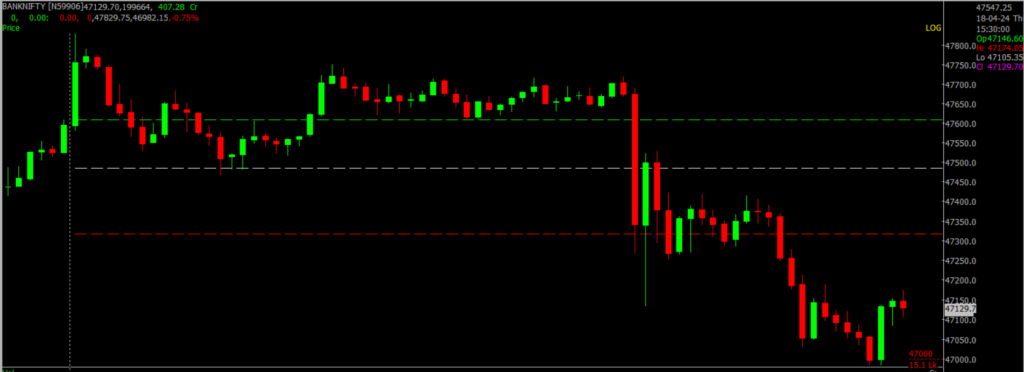
Prediction For Friday, Bank NIFTY can go up if it goes above 48,000 or down after the level of 47,000 but it all depends upon the Global cues.
Bank Nifty Index remains under the grip of bearish trends, encountering significant selling pressure during any upward movement, indicative of a prevalent “sell on rise” attitude among traders. The index faces strong resistance at the 48,000 to 48,300 range, a level marked by considerable call writing, suggesting solid resistance. With the overall market sentiment staying bearish, if the sell-off extends, the index might move toward its next major support levels at 47,000 to 46,800.
| Highest Call Writing at | 48,000 (26.1 Lakhs) |
| Highest Put Writing at | 47,000 (15.1 Lakhs) |
Bank Nifty Support and Resistance
| Support | 47,000, 46,800 |
| Resistance | 48,000, 48,300 |
Click here to learn the Stocks to Watch as Tensions Between Israel and Iran Escalates.
Join our upcoming free Webinar on Understanding Price Action Techniques: A Guide to Effective Trading
If you’d like to know how we analyze the market and provide accurate levels every day. then click on the Free Demo button below and change your trading life for good. 5X returns are possible in options trading If you have Spider Software in your trading system.
Disclaimer: The information provided in this Blog is for educational purposes only and should not be construed as financial advice. Trading in the stock market involves a significant level of risk and can result in both profits and losses. Spider Software & Team does not guarantee any specific outcome or profit from the use of the information provided in this Blog. It is the sole responsibility of the viewer to evaluate their own financial situation and to make their own decisions regarding any investments or trading strategies based on their individual financial goals, risk tolerance, and investment objectives. Spider Software & Team shall not be liable for any loss or damage, including without limitation any indirect, special, incidental or consequential loss or damage, arising from or in connection with the use of this blog or any information contained herein.


