
In the Stock Market Today, despite having volatility, Sensex and Nifty closed higher ahead of the Fed meeting results.
Stock Market Nifty Chart Prediction.
On March 20, Indian benchmark indices concluded with slight gains amidst a volatile trading session. Nifty ended up by +0.10% at 21,839.10, while the Sensex closed higher by +89.64 points at 72,101.69.
Top Performance in Nifty were Eicher Motors, Maruti Suzuki, Power Grid Corporation, Nestle India, and ONGC,
whereas Tata Steel, Tata Consumer Products, Tata Motors, Axis Bank, and Cipla were losers.
Various sectors such as auto, FMCG, realty, oil & gas, and power gained +0.5% to +1%,
while the metal index observed a decline of nearly -1%.
Both the BSE Midcap and Smallcap indices ended the session without significant changes.
Stock Prediction for 21st March 2024.
| STOCK | Good Above | Weak Below |
| BPCL | 570 | 564 |
| COLPAL | 2678 | 2652 |
| INDUSTOWER | 250 | 245 |
| SHRIRAMFIN | 2325 | 2300 |
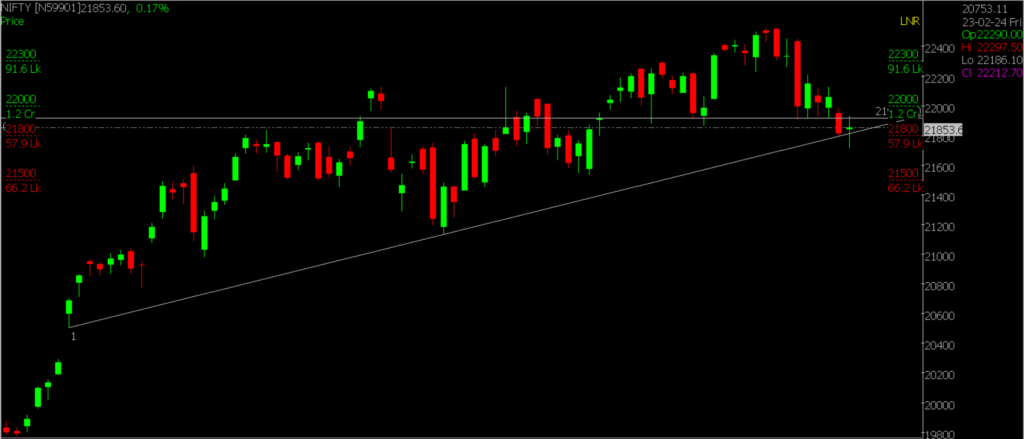
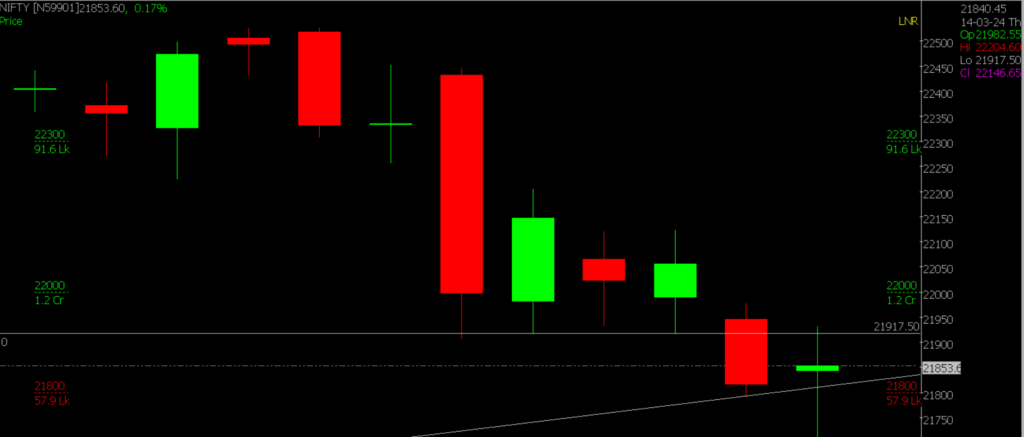
Prediction For Thursday, NIFTY can go up if it goes above 22,000 or down after the level of 21,800 but all depends upon the Global cues.
Today, Nifty went through ups and downs. It started low around 21,710.65, then went up past 21,900, peaking at 21,930 before ending at 21,855.10. The daily chart showed a doji candlestick, hinting at ongoing bearish pressure. According to technical analysis, Nifty broke its daily trend line, indicating a possible change in direction. Key levels to watch are 22,000 resistance and 21,800 support. If it drops below 21,700, it might continue down to 21,500.
| Highest Call Writing at | 22,000 (1.2 Crores) |
| Highest Put Writing at | 21,800 (57.9 Lakhs) |
Nifty Support and Resistance
| Support | 21,800, 21,500 |
| Resistance | 22,000, 22,300 |
Bank Nifty Daily Chart Prediction.
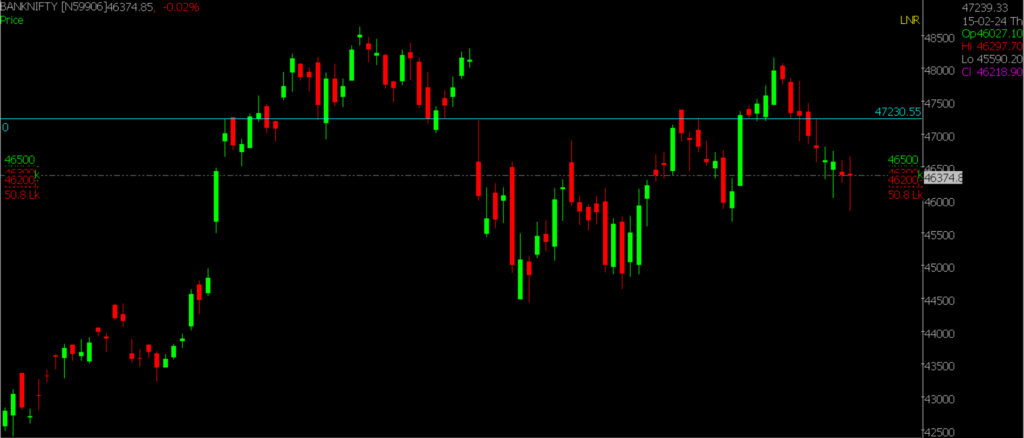
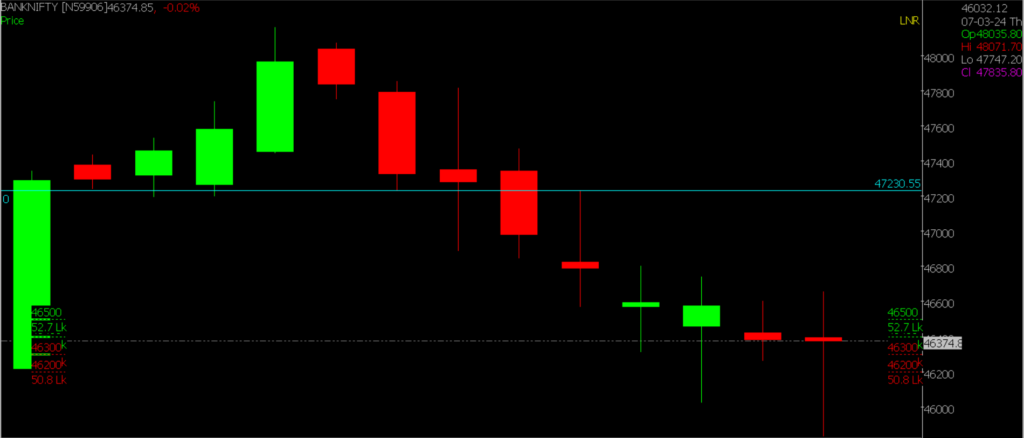
Prediction For Thursday, Bank NIFTY can go up if it goes above 46,500 or down after the level of 46,300 but it all depends upon the Global cues.
Amid ongoing fluctuations, Bank Nifty faced resistance from both bulls and bears, especially in anticipation of the US Fed meeting. The crucial support zone lies between 46,300-46,200, and sustaining these levels by the end of the day indicates a prevailing bullish sentiment. Immediate hurdles are at 46,500, and surpassing this level will set the target at 47,230.
| Highest Call Writing at | 46,500 (52.7 Lakhs) |
| Highest Put Writing at | 46,300 (57.9 Lakhs) |
Bank Nifty Support and Resistance
| Support | 46,300, 46,200 |
| Resistance | 46,500, 47,230 |
Click here to learn about the Top 5 Powerful Candlestick Patterns to know in Stock Market 2024
Join our upcoming FREE WEBINAR on Identifying reversal points with the help of OI & PCR data.
If you’d like to know how we analyze the market and provide accurate levels every day. then click on the Free Demo button below and change your trading life for good. 5X returns are possible in options trading If you have Spider Software in your trading system.
Disclaimer: The information provided in this Blog is for educational purposes only and should not be construed as financial advice. Trading in the stock market involves a significant level of risk and can result in both profits and losses. Spider Software & Team does not guarantee any specific outcome or profit from the use of the information provided in this Blog. It is the sole responsibility of the viewer to evaluate their own financial situation and to make their own decisions regarding any investments or trading strategies based on their individual financial goals, risk tolerance, and investment objectives. Spider Software & Team shall not be liable for any loss or damage, including without limitation any indirect, special, incidental or consequential loss or damage, arising from or in connection with the use of this blog or any information contained herein.