The falling wedge pattern, formed by converging trend lines, signals a bullish trend after a decline in stock prices over time.
Traders use Wedge patterns to identify potential trend reversals in the stock market, with two types of wedge patterns, rising and falling, providing different signals depending on the breakout direction. Let’s talk about the falling wedge pattern or the bullish wedge pattern over here.
Understanding the Falling Wedge Pattern
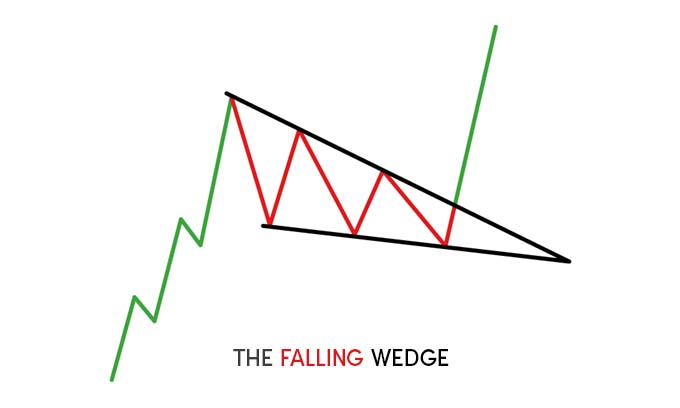
A falling wedge pattern is a chart pattern indicating a bullish trend. Two converging trend lines form a falling wedge pattern and the stock prices have fallen for a certain period.
Traders and analysts use the falling wedge pattern to identify potential trend reversals and to make trading decisions based on the pattern’s breakout direction.
An upward breakout from the wedge pattern can signal a potential rise in the stock price, making it an important tool for traders to make informed decisions and maximize profits in the stock market.
How to use the Falling Wedge Pattern for Profitable Trading.
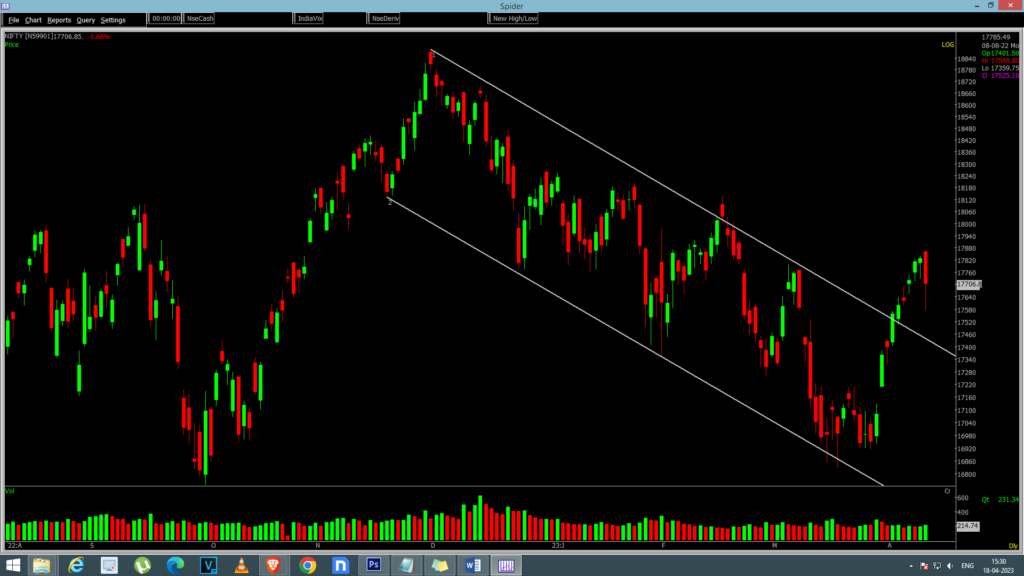
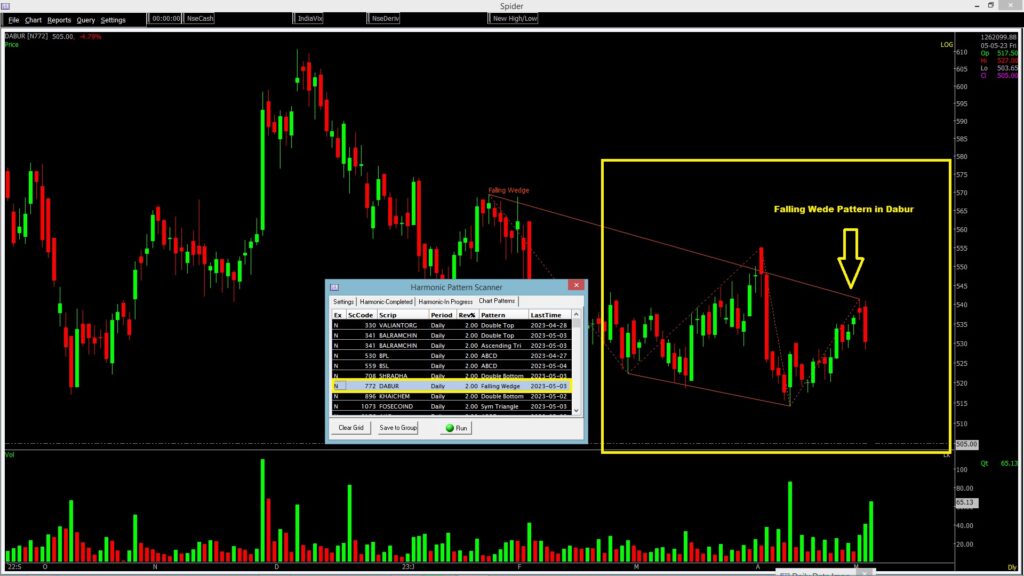
Above image is a perfect example of falling wedge pattern, where Two converging trend lines formed a falling wedge pattern and the stock prices have fallen for a certain period.
Once the Price of the stock breaks the upper trend line and closed above it. It’s a signal of bullishness as you can see in the picture.
sometimes, the price might break the above trendline and reverse back to the channel but to ensure the trend, we must wait for the confirmation.
How to Confirm the Trend Breakout?
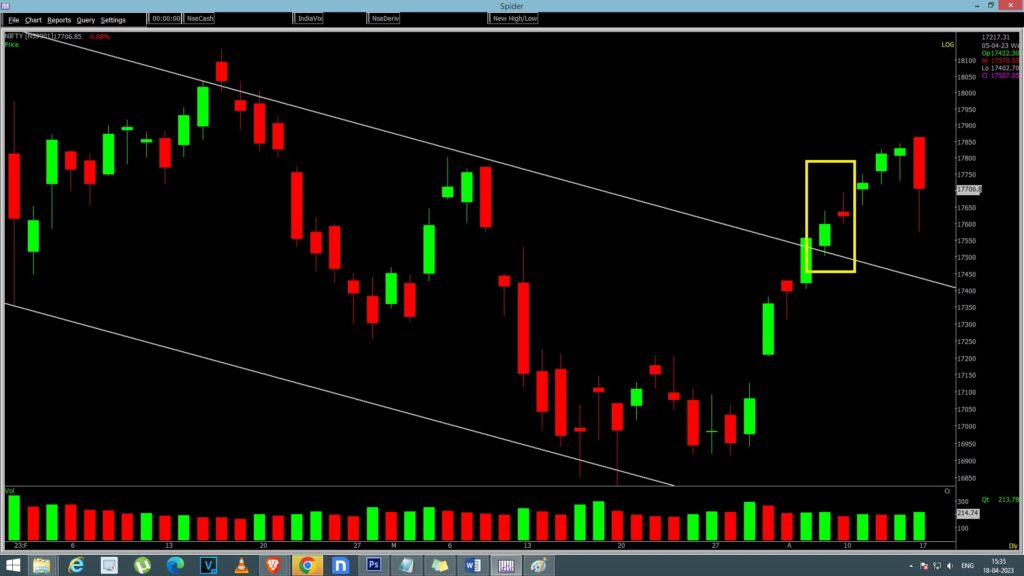
Once the price moves above the upper trend line, Wait for the second candle to form over the trend line. No matter the colour of the candle is Green or Red, as shown in the below picture.
What should be the Target?
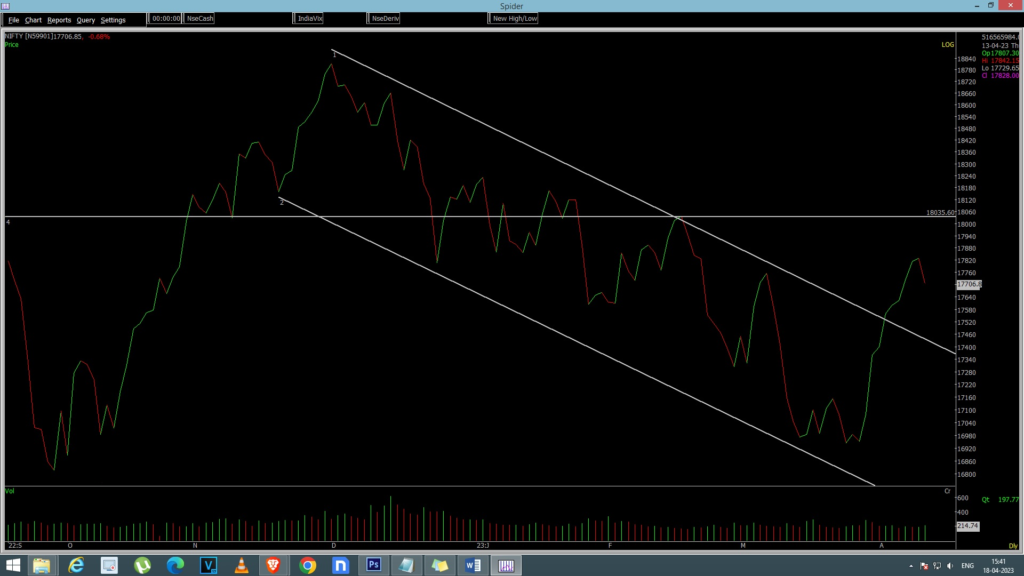
The price target is equal to the height of the back of the wedge. You can find the horizontal line on the below chart.
What should be the Stop-Loss?
Stop Loss can be placed at the upper side of the rising wedge line. You can use the retracement levels or the previous high level of the wedge. As shown in the below mentioned picture.

How to find the Stocks with Falling Wedge pattern Formation?
It is super easy to find any chart pattern using Spider Software, Falling Wedge can be found using the Chart Pattern Scanner of Spider, in just a couple of clicks.
Key Takeaways For Wedge Pattern
- Traders and analyst use wedge patterns mainly to identify potential trend reversals and make trading decisions in the stock market.
- There are two types of wedge patterns- Rising Wedge and Falling Wedge, each providing a different signal depending on the breakout direction.
- Traders use various technical indicators like moving averages, RSI, and price breakouts to identify potential entry and exit points.
- Successful implementation of this strategy requires discipline, risk management, and a solid understanding of market dynamics and Technical analysis principles.
Falling Wedge FAQs
Is a falling wedge bullish?
The wedge pattern has two types: rising wedge signals a potential downward trend reversal (bearish), while falling wedge suggests a possible upward trend reversal (bullish).
Is falling wedge bullish in downtrend?
When a falling wedge pattern is seen during a downtrend, it may indicate a possible change to an upward trend. This pattern is recognized by a series of lower highs and lower lows in price compared to previous movements. Traders often see this pattern as a sign to consider buying positions in the market.
What is the falling wedge in a downtrend?
When a falling wedge pattern emerges within a downtrend, it indicates a potential reversal in the market. This pattern forms when the price creates lower highs and lower lows, forming converging trendlines. Typically, the falling wedge pattern precedes an upward reversal, presenting potential opportunities for buyers to consider.
Disclaimer: The information provided in this Blog is for educational purposes only and should not be construed as financial advice. Trading in the stock market involves a significant level of risk and can result in both profits and losses. Spider Software & Team does not guarantee any specific outcome or profit from the use of the information provided in this Blog. It is the sole responsibility of the viewer to evaluate their own financial situation and to make their own decisions regarding any investments or trading strategies based on their individual financial goals, risk tolerance, and investment objectives. Spider Software & Team shall not be liable for any loss or damage, including without limitation any indirect, special, incidental or consequential loss or damage, arising from or in connection with the use of this blog or any information contained herein. ![]()


