
In the Stock Market Today, Around 22,000, Nifty hovers as Sensex dips by -454 points; small-caps show gains.
Stock Market Nifty Chart Prediction.
Indian benchmark indices recovered losses from the previous session, ending lower, with Nifty around 22,000.
At close, Sensex dropped -453.85 points to 72,643.43, and Nifty fell -123.40 points to 22,023.30.
Top Losers included BPCL, M&M, Tata Motors, Coal India, and L&T,
while Gainers were Bharti Airtel, UPL, Bajaj Finance, HDFC Life, and Adani Enterprises.
Except for Telecom, all sectoral indices closed in the red, with oil & gas, auto, capital goods, and healthcare down -1 to -2 per cent.
BSE Midcap index declined -0.5 per cent, while smallcap index ended positively.
Stock Prediction for 18th March 2024.
| STOCK | Good Above | Weak Below |
| CUMMINSIND | 2730 | 2700 |
| GLENMARK | 931 | 922 |
| TATASTEEL | 144 | 141 |
| ZYDUSLIFE | 985 | 976 |
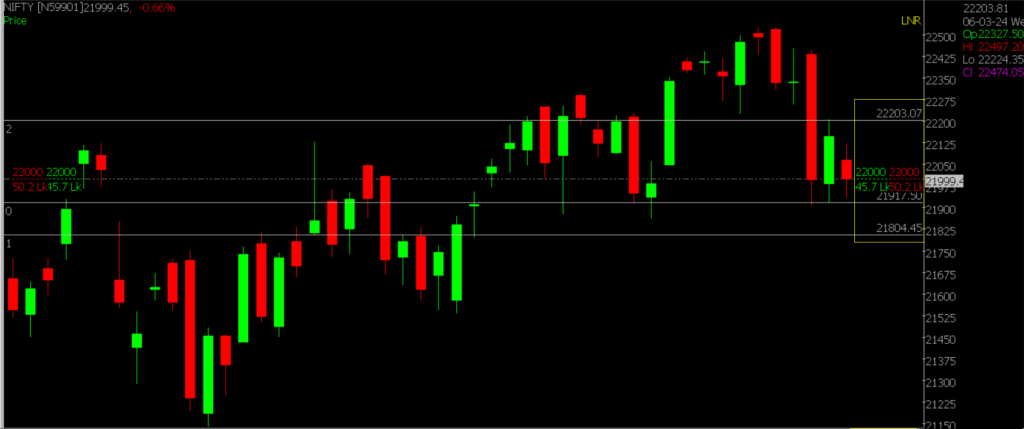
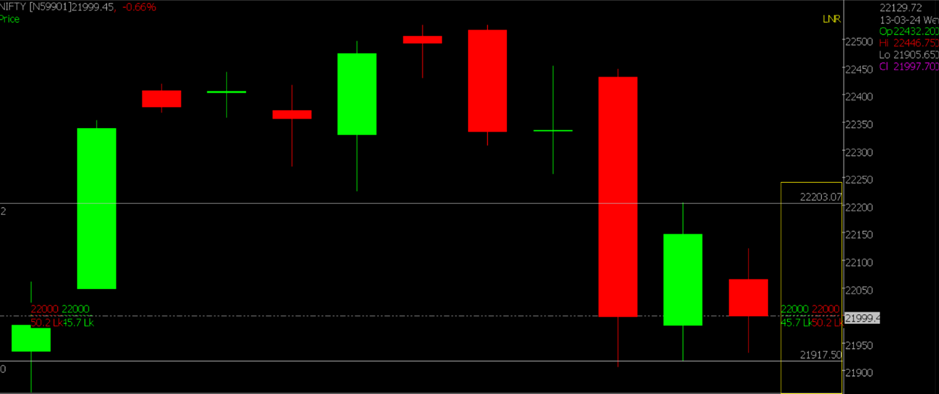
Prediction For Monday, NIFTY can go up if it goes above 22,000 or down after the level of 21,920 but all depends upon the Global cues.
Starting the day on a weak footing, Nifty experienced significant price fluctuations. While the first half showed a decline, a rebound later in the day helped Nifty recover from its intraday lows, albeit still closing with a negative trend, down by approximately -123 points. Examining the daily charts, it’s evident that Nifty managed to maintain its support range between 21900 and 21860 on Friday. In terms of levels, the immediate barrier zone lies between 22,000 and 22,200, while the crucial support range is between 21,920 and 21,800.
| Highest Call Writing at | 22,000 (45.7 Lakhs) |
| Highest Put Writing at | 21,920 (50.2 Lakhs) |
Nifty Support and Resistance
| Support | 21,920, 21,800 |
| Resistance | 22,000, 22,200 |
Bank Nifty Daily Chart Prediction.
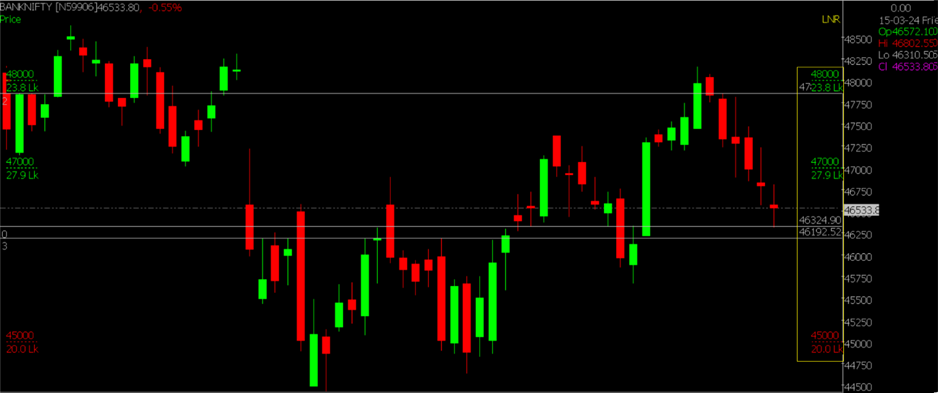
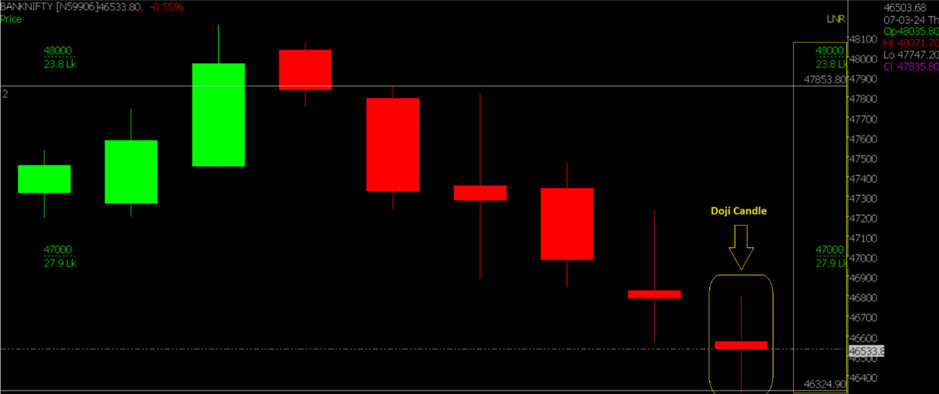
Prediction For Monday, Bank NIFTY can go up if it goes above 47,000 or down after the level of 46,320 but it all depends upon the Global cues.
Experiencing volatility, the BankNifty index encountered a trading session characterized by uncertainty, reflected by the formation of a doji candle. Expected resistance levels are anticipated between 47,000 and 47,850, while crucial support is seen at 46,320 to 45,190 on the downside.
| Highest Call Writing at | 47,000 (27.9 Lakhs) |
| Highest Put Writing at | 46,320 (20.0 Lakhs) |
Bank Nifty Support and Resistance
| Support | 46,320, 46,190 |
| Resistance | 47,000, 47,850 |
Click here to learn about the Top 5 Powerful Candlestick Patterns to know in Stock Market 2024
Join our upcoming FREE WEBINAR on Identifying reversal points with the help of OI & PCR data.
If you’d like to know how we analyze the market and provide accurate levels every day. then click on the Free Demo button below and change your trading life for good. 5X returns are possible in options trading If you have Spider Software in your trading system.
Disclaimer: The information provided in this Blog is for educational purposes only and should not be construed as financial advice. Trading in the stock market involves a significant level of risk and can result in both profits and losses. Spider Software & Team does not guarantee any specific outcome or profit from the use of the information provided in this Blog. It is the sole responsibility of the viewer to evaluate their own financial situation and to make their own decisions regarding any investments or trading strategies based on their individual financial goals, risk tolerance, and investment objectives. Spider Software & Team shall not be liable for any loss or damage, including without limitation any indirect, special, incidental or consequential loss or damage, arising from or in connection with the use of this blog or any information contained herein.