Learn these 8 essential chart patterns to boost your stock market skills and master your trading strategy.
1. Head and Shoulders:
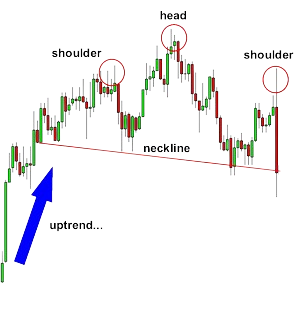
A head and shoulders pattern is like three bumps on a chart. The middle one is the biggest, and the ones on the sides are a bit smaller. These bumps usually drop down to a certain line called the “Neckline.” When the last bump falls to that line, it often means the price might start going down.
As shown in the image you can see that the second peak is the head and the other two peaks will be the shoulder. All peaks will fall downtrend to the same support forming ‘Neckline’.
2. Double top:
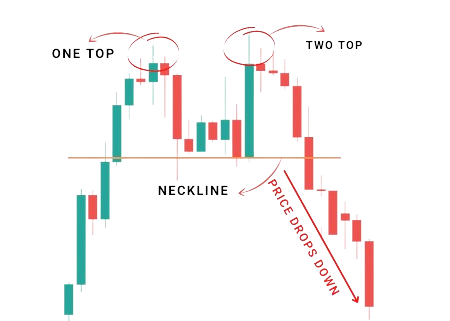
A double top is a pattern traders use to spot changes in trends. Usually, the price of an asset reaches a high point and then drops back to a support level. After that, it rises again before changing direction against the main trend.
As shown in the image, the double top pattern is recognizable by its ‘M’ shape on the chart, signaling a bearish price movement. Traders often interpret it as a signal to anticipate a downward movement in price.
3. Double Bottom:
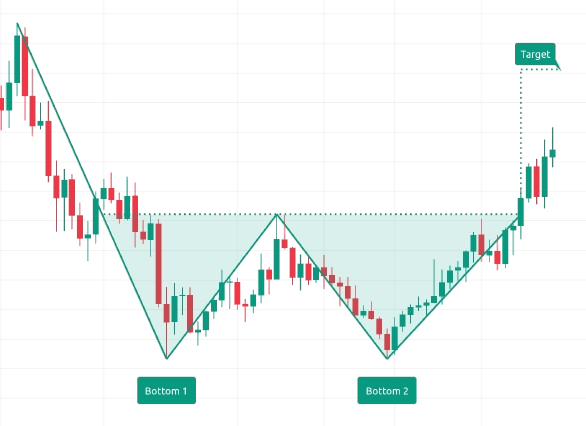
A double bottom pattern shows when the price of something falls a lot and then bounces back up from a certain point. After that, it might go down again before changing direction and starting to go up. This pattern is seen as a sign that a downtrend is ending and the market is becoming more positive.
As shown in the image it forms a ‘W’ shape on the chart. It will rise back from the support zone and will soon form a neckline in a reversal pattern.
4. Ascending Triangle:
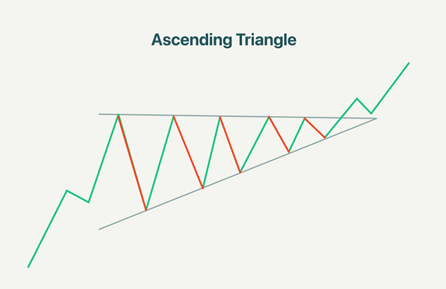
An ascending triangle is a pattern that suggests an uptrend will keep going. You can see it on a chart by drawing a line across the high points (resistance) and another line slanting up from the low points (support). In this pattern, you have to draw a line between the swing highs and swing lows.
As shown in the image, two lines form a ‘Triangle’ which is often indicated as a breakout trend.
5. Descending Triangle:
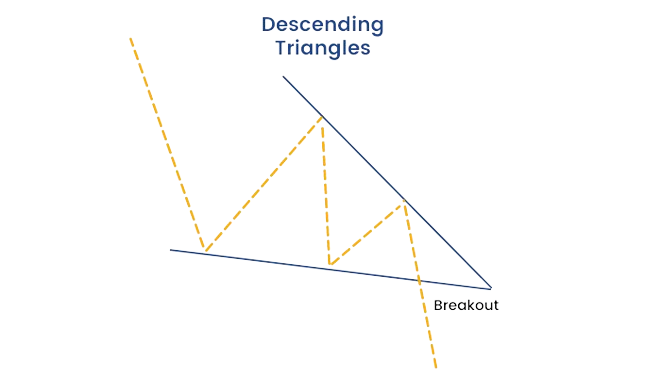
A descending triangle shows a trend where prices are likely to keep going down. Traders use this pattern to make money when the market is in a downward trend. It happens when there are many lower peaks in a falling trend on the chart.
You can spot a descending triangle on a chart by looking for a flat line and a slanting line. These lines show where the price tends to stop going up (resistance) and where it tends to stop going down (support). When the price falls below the support line, sellers become more active, and the downtrend is likely to keep going.
6. Wedges:
A wedge is a pattern on a price chart where you draw two lines to see the highs and lows of prices over time. There are two kinds of wedges: a ‘Rising Wedge’ and a ‘Falling Wedge,’ which help predict how the market might move.
A} Rising Wedge:
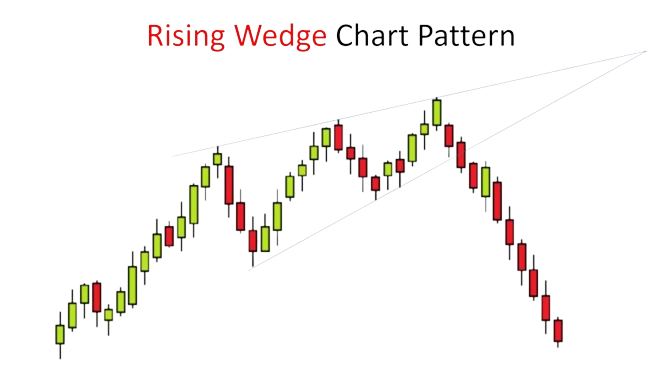
A rising wedge is recognized by two trend lines, one indicating support and the other resistance, both following an upward or rising trend.
B} Falling Wedge:
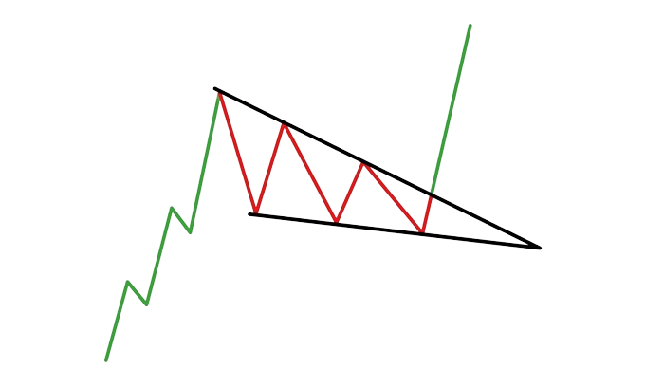
A rising wedge is recognized by two trend lines, one indicating support and the other resistance, both following a downward or falling trend.
7. Cup And Handle:
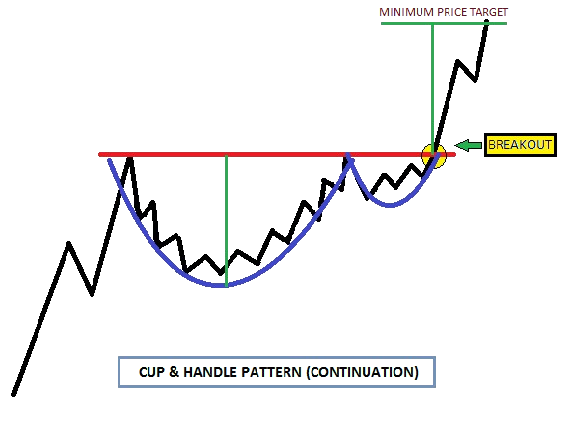
A cup and handle pattern happens when the market goes down for a bit (the cup), then starts going up again (the handle), showing a positive trend. It’s seen as a chance to buy.
The “Handle” part is important because when the price settles down a bit, traders see it as a good time to buy. Once the price stabilizes, it often goes up a lot.
As shown in the image cup is similar to the Rounding chart pattern whereas the handle is similar to the Wedge chart pattern.
8. Rounding Top Or Bottom:
The rounding top or bottom pattern is a type of pattern that suggests a possible change in direction for either upward or downward trends. You can spot this pattern by looking for a curved shape at the top or bottom of a trend, along with a neckline. The rounded pattern looks similar in both cases, but the top and bottom parts are different.
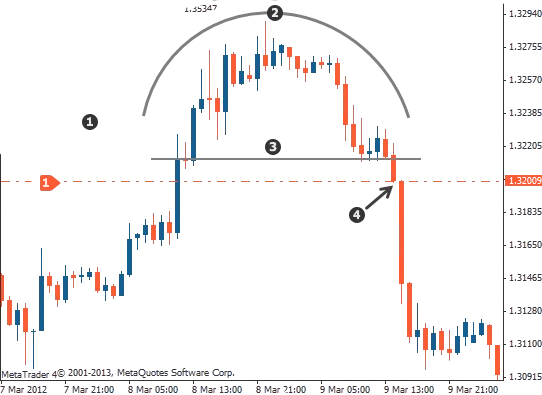
As shown in the image, the shape of the Rounding top is like ‘Upside- Down’ which indicates a reversal reach from bullish to bearish.
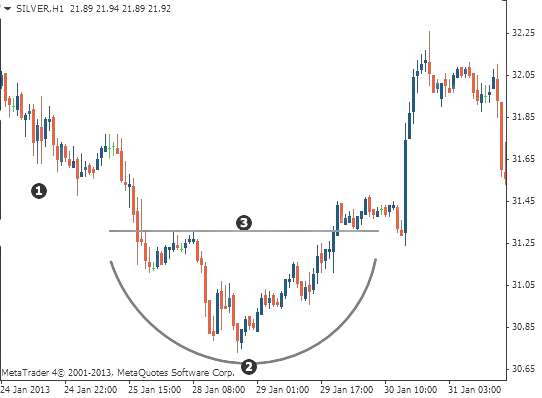
As shown in the image the shape of the Rounding bottom is like ‘U’ which indicates a reversal reach from bearish to bullish.
Click here to learn about the Top 5 Powerful Candlestick Patterns to know in Stock Market 2024
Join our upcoming FREE WEBINAR on How to use Payoff Calculator in Spider Software
If you’d like to know how we analyze the market and provide accurate levels every day. then click on the Free Demo button below and change your trading life for good. 5X returns are possible in options trading If you have Spider Software in your trading system.
Disclaimer: The information provided in this Blog is for educational purposes only and should not be construed as financial advice. Trading in the stock market involves a significant level of risk and can result in both profits and losses. Spider Software & Team does not guarantee any specific outcome or profit from the use of the information provided in this Blog. It is the sole responsibility of the viewer to evaluate their own financial situation and to make their own decisions regarding any investments or trading strategies based on their individual financial goals, risk tolerance, and investment objectives. Spider Software & Team shall not be liable for any loss or damage, including without limitation any indirect, special, incidental or consequential loss or damage, arising from or in connection with the use of this blog or any information contained herein.