Traders widely utilize the Relative Strength Indicator as a popular tool for technical analysis. It measures strength and momentum of price.
What is Relative Strength Indicator?
The Relative Strength Indicator (RSI) finds application across various financial instruments, including stocks, commodities, currencies, and indices, making it a versatile indicator for measuring the strength and momentum of price trends.The RSI calculates and displays the ratio of upward price movements to downward price movements over a specified period, typically 14 trading days.The Relative Strength Indicator (RSI) expresses itself as an oscillator that ranges from 0 to 100. RSI uses price cycles and overbought/oversold conditions to indicate possible reversals in price trends.
How does Relative Strength Indicator works?
The Relative Strength Indicator (RSI) works by analyzing the ratio of upward price movements to downward price movements over a specific period of time. The RSI formula consists of several steps:
To calculate the Relative Strength (RS), divide the average of the gains observed during the specified period by the average of the losses witnessed during the same period.The gains are the positive price changes, while the losses are the negative price changes
RS = Average Gain / Average Loss
The RSI formula calculates the Relative Strength Index (RSI) by using the following calculation to express it as an oscillator ranging from 0 to 100
RSI = 100 – (100 / (1 + RS))
This formula normalizes the RS and scales it to a value between 0 and 100.
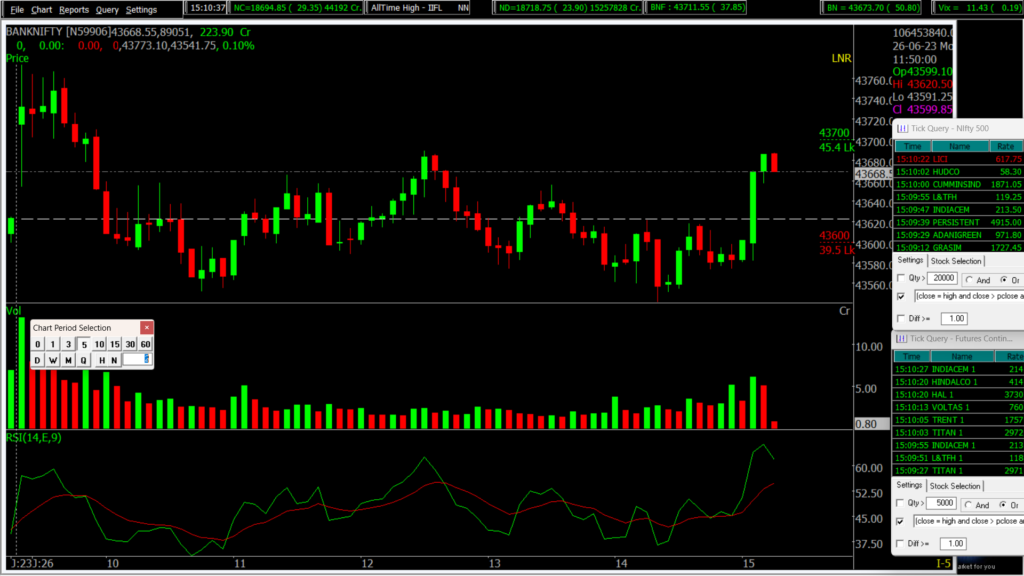
Plotting the RSI: Traders typically plot the RSI values on a separate chart below the price chart.
The RSI line ranges between 0 and 100, with the overbought level typically set at 70 and the oversold level at 30. The RSI provides insights into the strength and momentum of a price trend. It helps traders and investors identify overbought and oversold conditions in the market.
An RSI above 70 suggests price overbought conditions and indicates a potential reversal or correction in the market. An RSI below 30 suggests price oversold conditions and signals a potential bounce or reversal in the market.
Traders combine the RSI with other technical analysis tools to confirm signals and make informed trading decisions.
How to use Relative Strength Indicator in Spider Software?
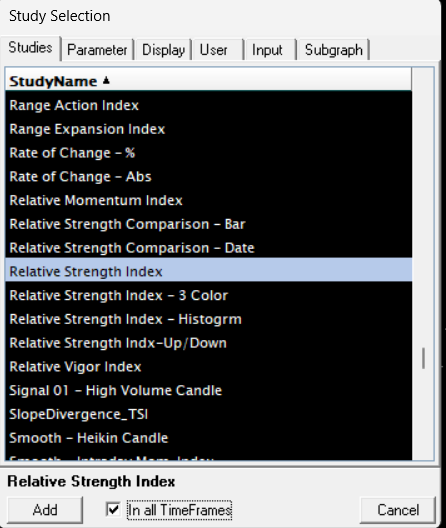
Press S -> Select Parametres -> Apple -> OK
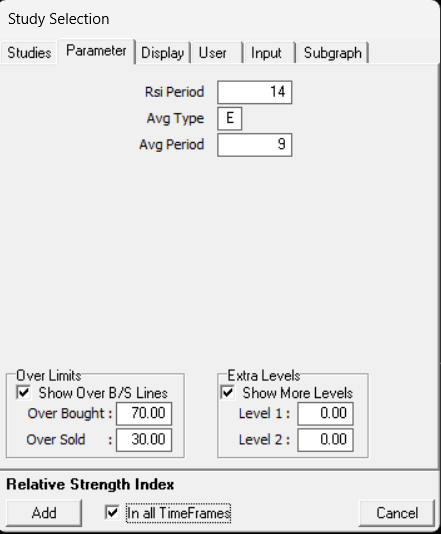
Parameters for Relative Strength Indicator Indicator (14, E, 9)
Also, Check out our article on Tax Deducted at Source (TDS)
Disclaimer: The information provided in this Blog is for educational purposes only and should not be construed as financial advice. Trading in the stock market involves a significant level of risk and can result in both profits and losses. Spider Software & Team does not guarantee any specific outcome or profit from the use of the information provided in this Blog. It is the sole responsibility of the viewer to evaluate their own financial situation and to make their own decisions regarding any investments or trading strategies based on their individual financial goals, risk tolerance, and investment objectives. Spider Software & Team shall not be liable for any loss or damage, including without limitation any indirect, special, incidental or consequential loss or damage, arising from or in connection with the use of this blog or any information contained herein. ![]()