The ADX Indicator is a widely-used tool or indicator in financial markets that helps traders identify whether the given index is sideways or in trend.
What is ADX Indicator?
Traders and investors use the ADX (Average Directional Index) as a technical indicator in financial markets to measure the strength and direction of a trend. Developed by J. Welles Wilder, Jr., the ADX is part of the family of indicators known as the Directional Movement System.
The ADX is represented as a single line that ranges between 0 and 100. The indicator does not provide information about the direction of the trend but rather focuses on its strength. A higher ADX value indicates a stronger trend, while a lower ADX value suggests a weaker or non-existent trend.
The ADX derives from two other indicators: the positive directional indicator (+DI) and the negative directional indicator (-DI). These indicators calculate the ADX by measuring the strength of positive and negative price movements over a specified period of time.
Traders and investors use the ADX to make decisions about entering or exiting trades. When the ADX is rising, it suggests that a trend is strengthening, and traders may consider entering positions in the direction of the trend. Conversely, when the ADX is falling, it indicates a weakening trend, and traders may consider exiting or avoiding trades.
How does ADX Indicator works?
It consists of three lines: the ADX line itself, along with two additional lines called the Positive Directional Indicator (+DI) and the Negative Directional Indicator (-DI).
Here’s a step-by-step explanation of how the ADX indicator works:
- Calculate the True Range (TR): The True Range measures the volatility of a market by finding the greatest of the following three values:
- The difference between the current high and low.
- The absolute value of the current high minus the previous close.
- The absolute value of the current low minus the previous close.
- Calculate the Directional Movement (DM): The DM measures the upward and downward movement of price over a specific period. It is calculated as follows:
- Positive Directional Movement (+DM): The current high minus the previous high (if it’s positive) or zero.
- Negative Directional Movement (-DM): The previous low minus the current low (if it’s positive) or zero.
3. Smooth the +DM and -DM values: To obtain a more usable value, Wilder applied a smoothing technique called the Wilder’s Moving Average. This smoothing process helps to filter out short-term fluctuations and noise in the price movements.
4. Calculate the Directional Indicators (+DI and -DI): These indicators represent the ratio of the smoothed +DM and -DM values to the Average True Range (ATR) over the same period, typically 14 periods. The formulas are as follows:
- +DI = 100 times the exponential moving average of +DM divided by ATR
- Calculate the Average Directional Index (ADX): The ADX itself is derived from the difference between the +DI and -DI, as well as their sum. The formula is:
- ADX = 100 times the exponential moving average of the absolute value of (+DI – -DI) divided by (+DI + -DI)
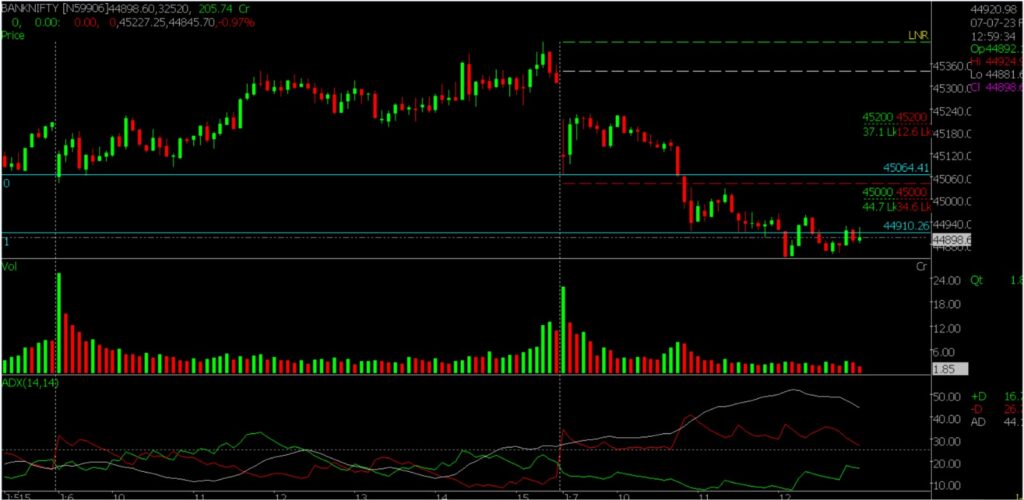
How to use ADX Indicator in Spider Software?
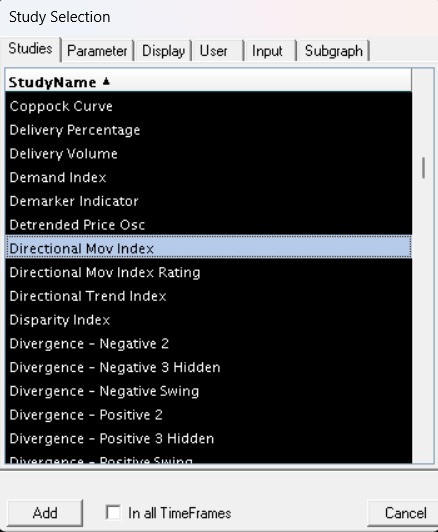
Press S -> Select Parametres -> Apple -> OK
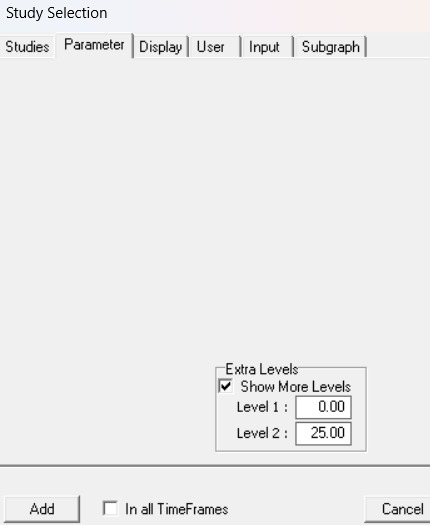
Parameters for ADX indicator (Level 1 and Level 2)
Conclusion
The ADX indicator is a valuable tool for traders and investors to assess the strength and direction of a trend in a financial market. Here are some key points to summarize its significance:
- Trend Identification: The ADX helps traders identify whether a market is trending or ranging. A reading above 20 indicates the presence of a trend, while a reading below 20 suggests a weak or non-existent trend.
- Trend Strength: The ADX also measures the strength of a trend. Higher ADX values, such as 40 or above, indicate a strong trend, while lower values indicate a weaker trend.
- Lagging Indicator: The ADX is a lagging indicator, as it relies on past price action. Traders should consider using it in conjunction with other technical analysis tools to confirm trends and generate trading signals.
- Directional Movement Indicators: The +DI and -DI lines that accompany the ADX provide information about the positive and negative directional movement of price. Traders can use these indicators to assess the bullish or bearish sentiment in the market.
- Confirmation and Divergence: Traders often look for confirmation between the ADX, price action, and other indicators. Divergence between the ADX and price movement can signal potential trend reversals.
- Risk Management: The ADX can help traders in setting stop-loss levels, managing risk, and avoiding trades in choppy or sideways markets.
Also, Check out our article on Nifty All-Time Highs: Should You Be Greedy or Fearful for Q1?
Disclaimer: The information provided in this Blog is for educational purposes only and should not be construed as financial advice. Trading in the stock market involves a significant level of risk and can result in both profits and losses. Spider Software & Team does not guarantee any specific outcome or profit from the use of the information provided in this Blog. It is the sole responsibility of the viewer to evaluate their own financial situation and to make their own decisions regarding any investments or trading strategies based on their individual financial goals, risk tolerance, and investment objectives. Spider Software & Team shall not be liable for any loss or damage, including without limitation any indirect, special, incidental or consequential loss or damage, arising from or in connection with the use of this blog or any information contained herein. ![]()